Fig. 13.
Download original image
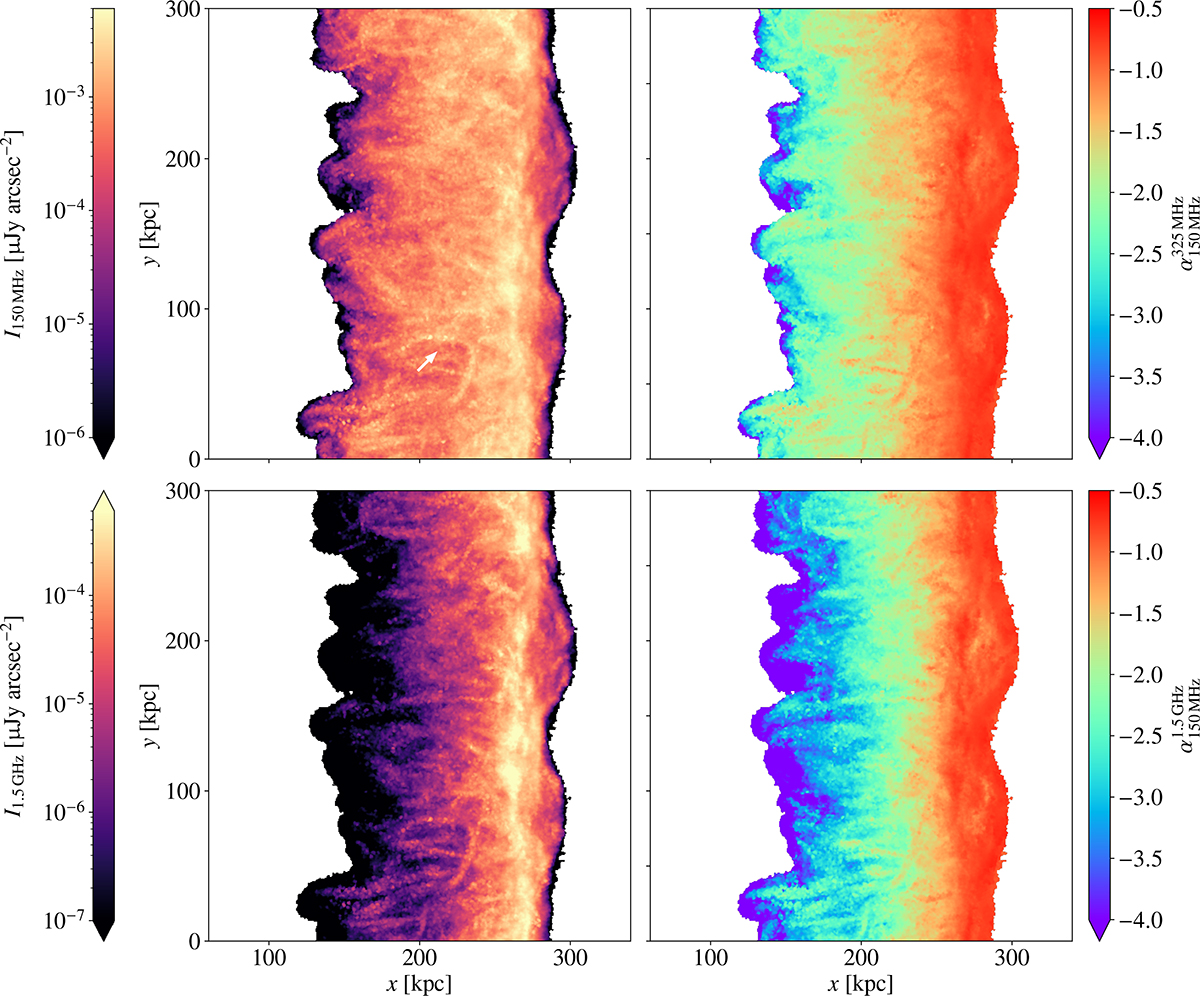
Left column: Synchrotron intensity at 150 MHz (top) and 1.5 GHz (bottom), respectively, for our fiducial Mach 3 simulation at t = 180 Myr. The projection depth is 300 kpc. Right column: Spectral index maps between 325 MHz and 150 MHz (top) and 1.5 GHz and 150 MHz (bottom), respectively. Intensity fluctuations in this region are a consequence of Mach number variations, whilst spectral index variations towards the shock front are predominantly a result of the corrugated shock front. Both intensity and spectral index maps show long striations predominantly orientated along the x axis, resulting from the magnetic filaments observed in Fig. 11. The white arrow indicates a particularly clear example caused by adiabatic compression of the post-shock magnetic field. An animated version of this figure can be found here.
Current usage metrics show cumulative count of Article Views (full-text article views including HTML views, PDF and ePub downloads, according to the available data) and Abstracts Views on Vision4Press platform.
Data correspond to usage on the plateform after 2015. The current usage metrics is available 48-96 hours after online publication and is updated daily on week days.
Initial download of the metrics may take a while.