Open Access
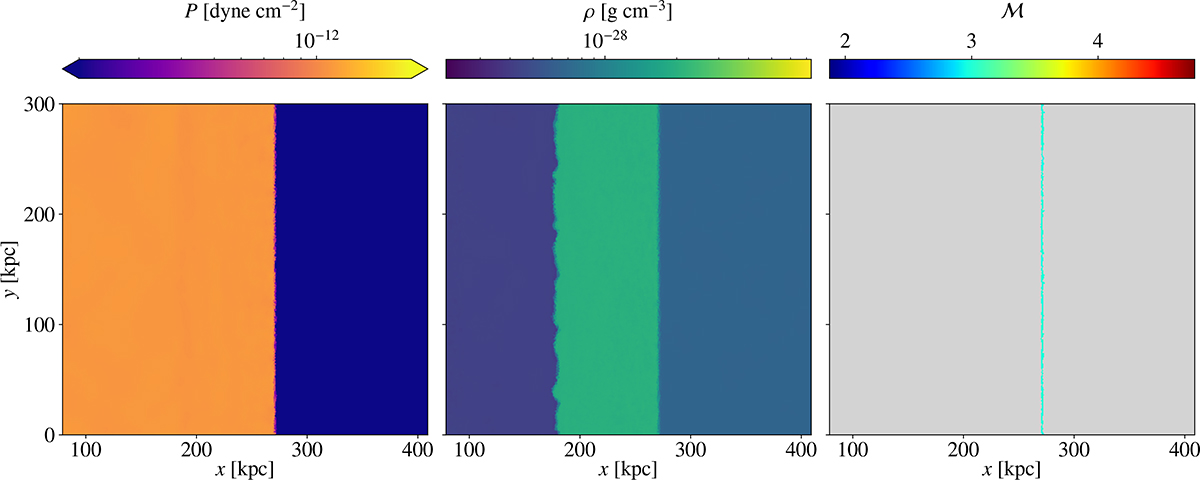
Fig. B.1.
Download original image
As Fig. 3, but only the top row is shown, and data are taken from the Flat simulation. Without upstream density fluctuations, the Rayleigh-Taylor instability is restricted to a very low growth rate.
Current usage metrics show cumulative count of Article Views (full-text article views including HTML views, PDF and ePub downloads, according to the available data) and Abstracts Views on Vision4Press platform.
Data correspond to usage on the plateform after 2015. The current usage metrics is available 48-96 hours after online publication and is updated daily on week days.
Initial download of the metrics may take a while.