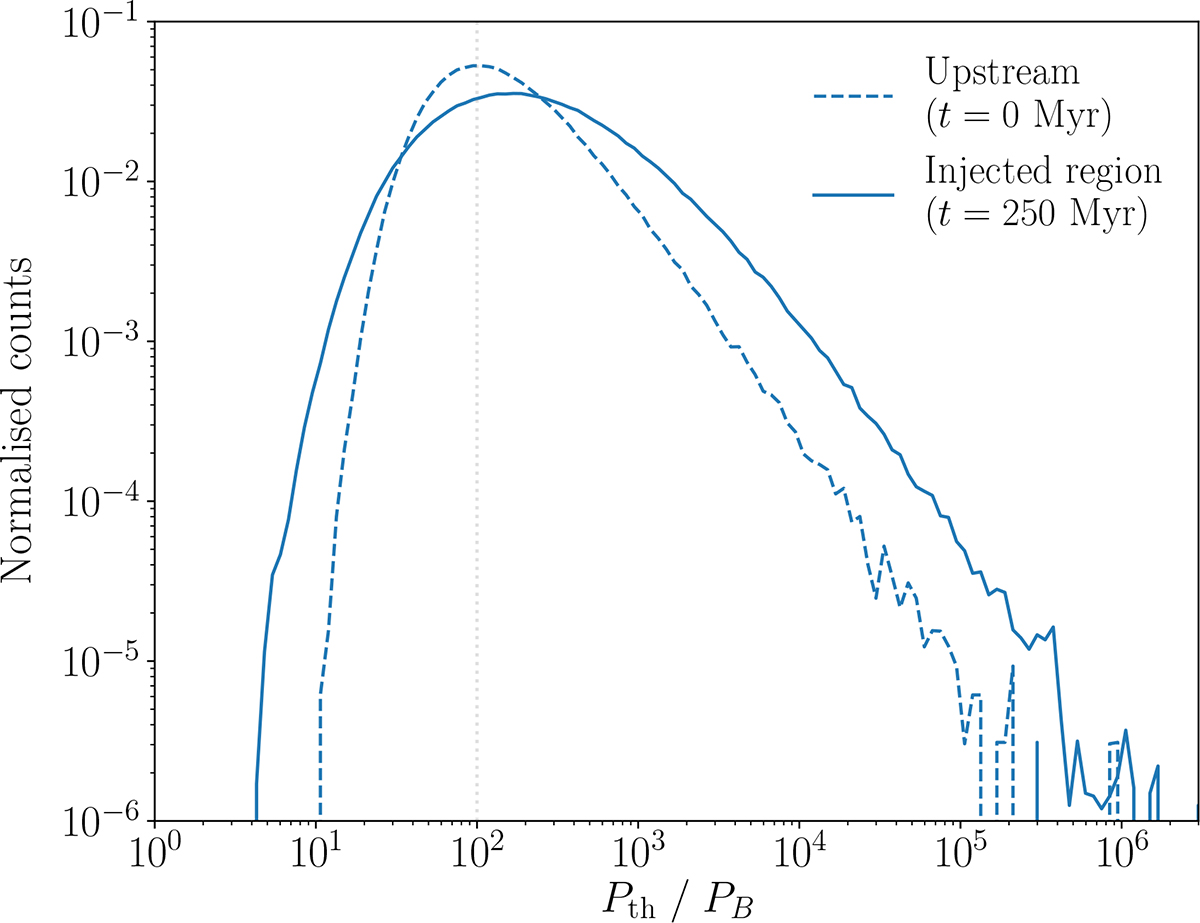
Fig. F.1.
Download original image
Histograms of the plasma beta values for all gas cells upstream at t = 0 Myr (dashed) and in the shock-injected region at t = 250 Myr (solid) for our Mach 3 fiducial simulation, weighted by the cell volume. The distribution initially peaks at 100 (marked by a dotted, grey line). Amplification downstream is able to increase the magnetic field pressure up to ∼10% of the gas pressure in a fraction of the cells.
Current usage metrics show cumulative count of Article Views (full-text article views including HTML views, PDF and ePub downloads, according to the available data) and Abstracts Views on Vision4Press platform.
Data correspond to usage on the plateform after 2015. The current usage metrics is available 48-96 hours after online publication and is updated daily on week days.
Initial download of the metrics may take a while.