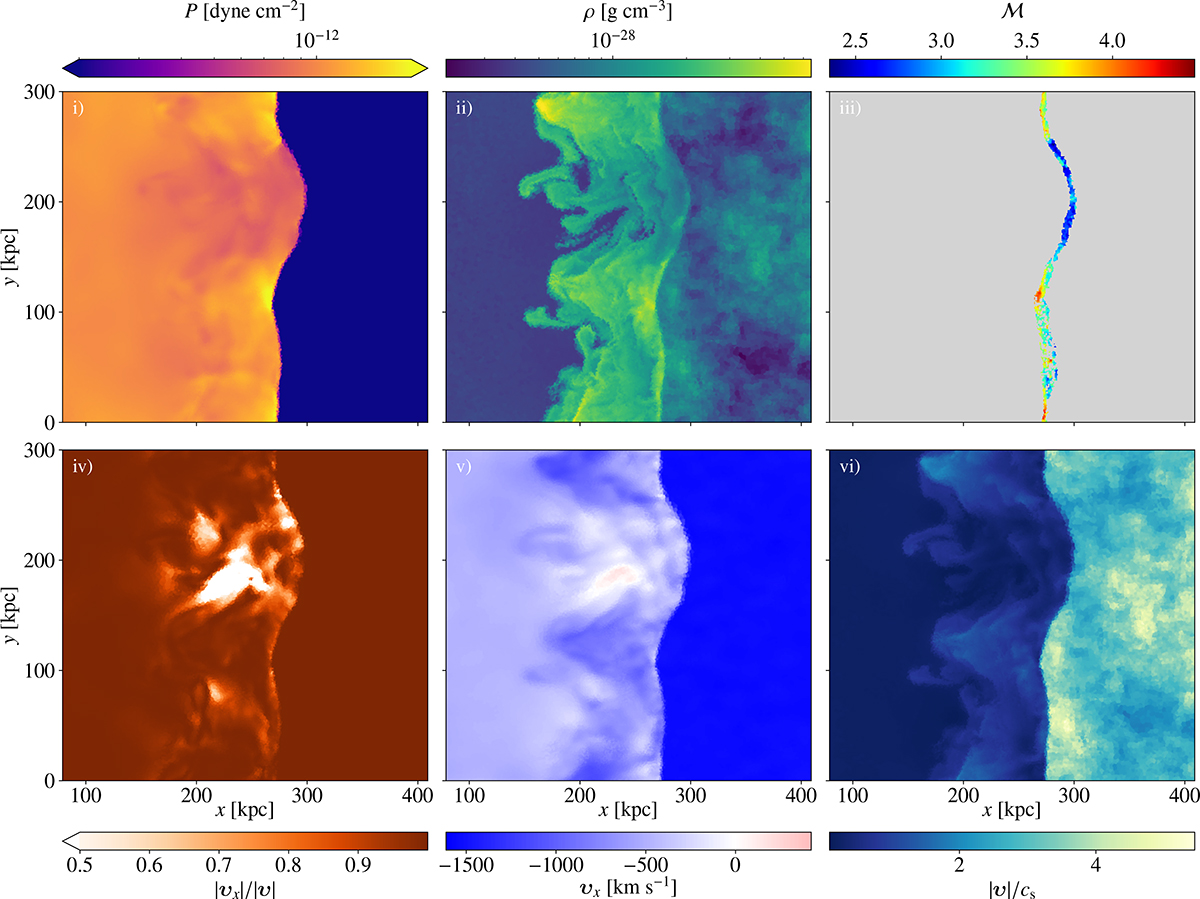
Fig. 3.
Download original image
Mach 3 shock is driven into a turbulent upstream density field. The initial pressure and density values for the shock tube correspond to those shown in Fig. 2. Panels: (i) gas pressure, (ii) gas density, (iii) dissipated-energy-weighted Mach number, (iv) the fraction of the gas speed in the x-component, (v) the x-component of gas velocity, (vi) gas speed divided by sound speed. Data are shown in slices except for (iii), which is a thin projection of 35 kpc. All values are shown in the shock rest frame at t = 180 Myr. Upstream density turbulence directly leads to shock corrugation, a distribution of Mach numbers at the shock front, and downstream velocity turbulence. An animated version of this figure can be found here.
Current usage metrics show cumulative count of Article Views (full-text article views including HTML views, PDF and ePub downloads, according to the available data) and Abstracts Views on Vision4Press platform.
Data correspond to usage on the plateform after 2015. The current usage metrics is available 48-96 hours after online publication and is updated daily on week days.
Initial download of the metrics may take a while.