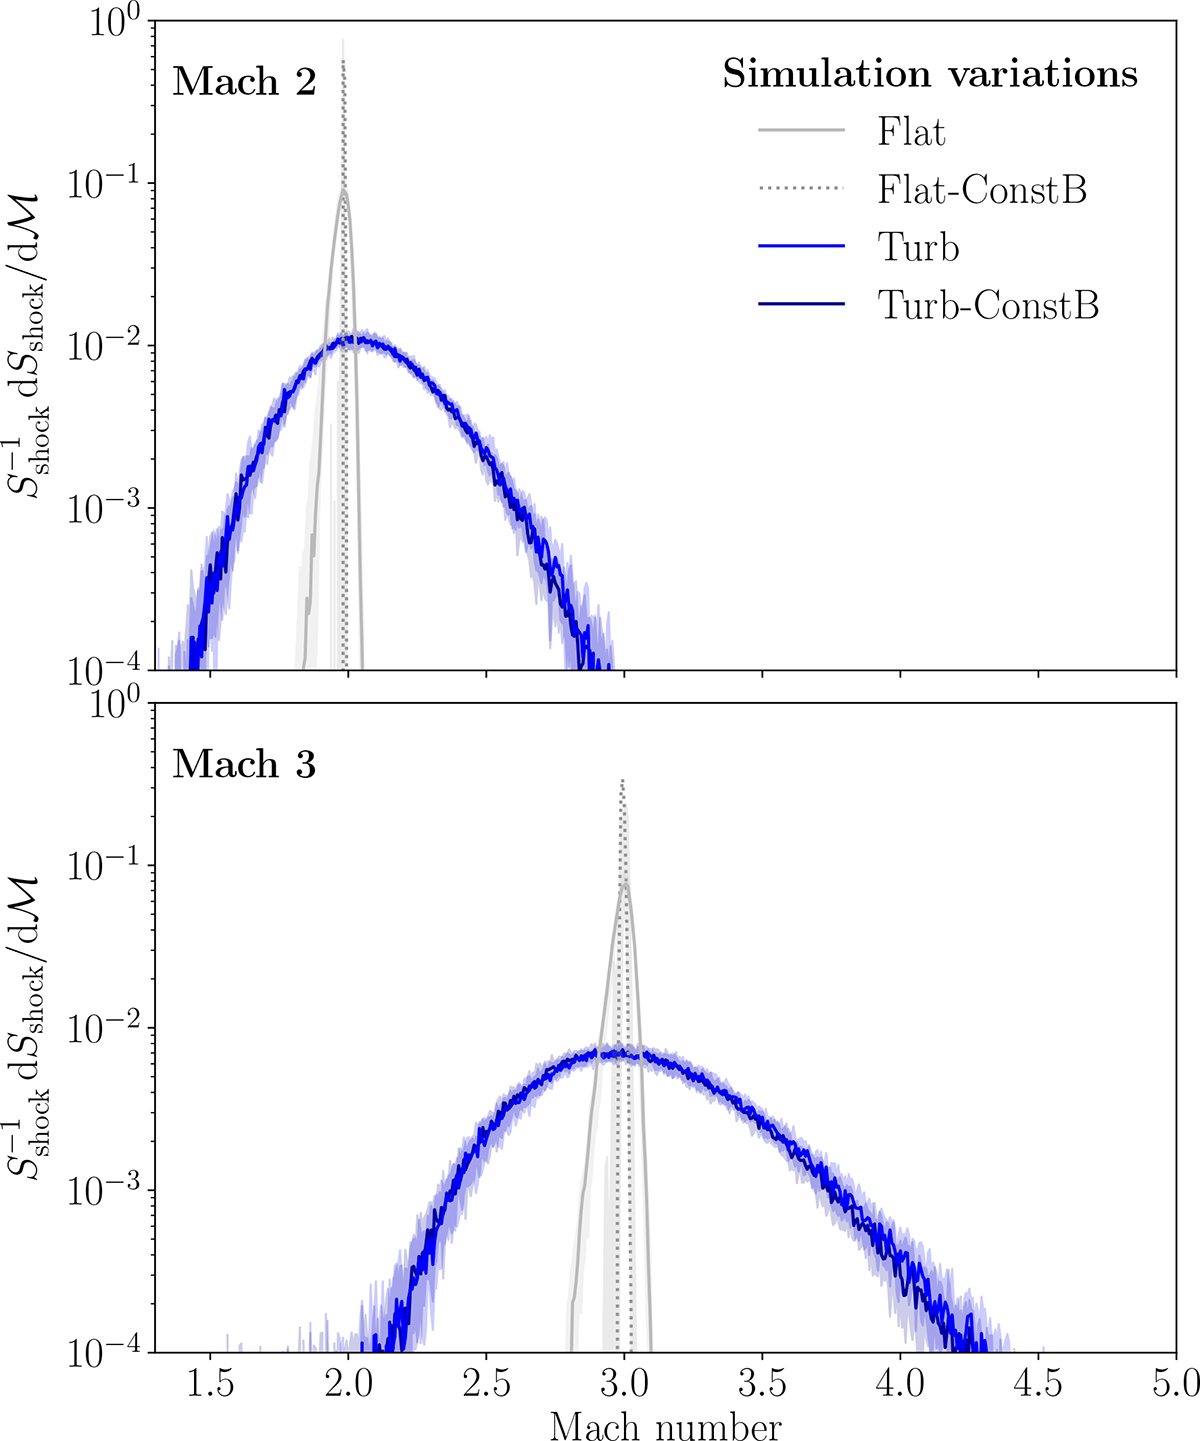
Fig. 5.
Download original image
Mach number distributions for all models, where each cell has been weighted by its normalised contribution to the shock surface. Lines indicate the median taken over all snapshots, whilst the shaded values indicate the interquartile range. The addition of magnetic turbulence (Flat) to a homogeneous density distribution (Flat-ConstB) broadens the distribution only very mildly. By contrast, the addition of upstream density fluctuations in the simulation (Turb and Turb-ConstB) turns an extremely narrow distribution into a much broader one. The width of the distribution is proportional to the peak Mach number.
Current usage metrics show cumulative count of Article Views (full-text article views including HTML views, PDF and ePub downloads, according to the available data) and Abstracts Views on Vision4Press platform.
Data correspond to usage on the plateform after 2015. The current usage metrics is available 48-96 hours after online publication and is updated daily on week days.
Initial download of the metrics may take a while.