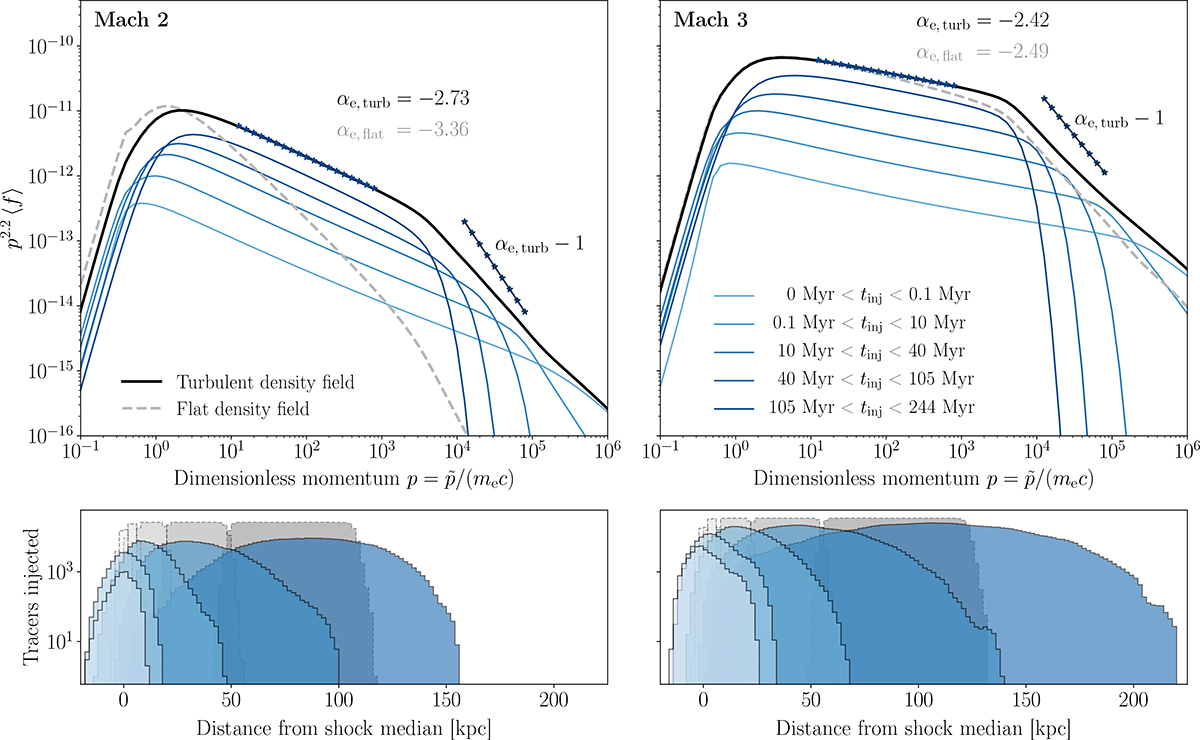
Fig. 6.
Download original image
Top row: Volume-weighted non-thermal electron spectra generated from our Turb (solid black) and Flat (dashed grey) simulations at t = 250 Myr. Blue lines show contributions to the Turb spectrum, where tracers have been binned by time since injection. Bottom row: Histograms indicating the total number of injected tracers relative to the shock front, where bins have a width of 2 kpc. Blue and grey colours represent our Turb and Flat simulations respectively, whilst colour saturations indicate the same time bins as above. The broadened Mach number distribution seen in Fig. 5 causes a shallower slope, αe, in the Turb runs compared to the theoretical expectation. This is especially noticeable for low Mach number shocks. In the case of upstream density fluctuations, substantial mixing takes place downstream, such that distance from the shock front is no longer a good indication of cooling time.
Current usage metrics show cumulative count of Article Views (full-text article views including HTML views, PDF and ePub downloads, according to the available data) and Abstracts Views on Vision4Press platform.
Data correspond to usage on the plateform after 2015. The current usage metrics is available 48-96 hours after online publication and is updated daily on week days.
Initial download of the metrics may take a while.