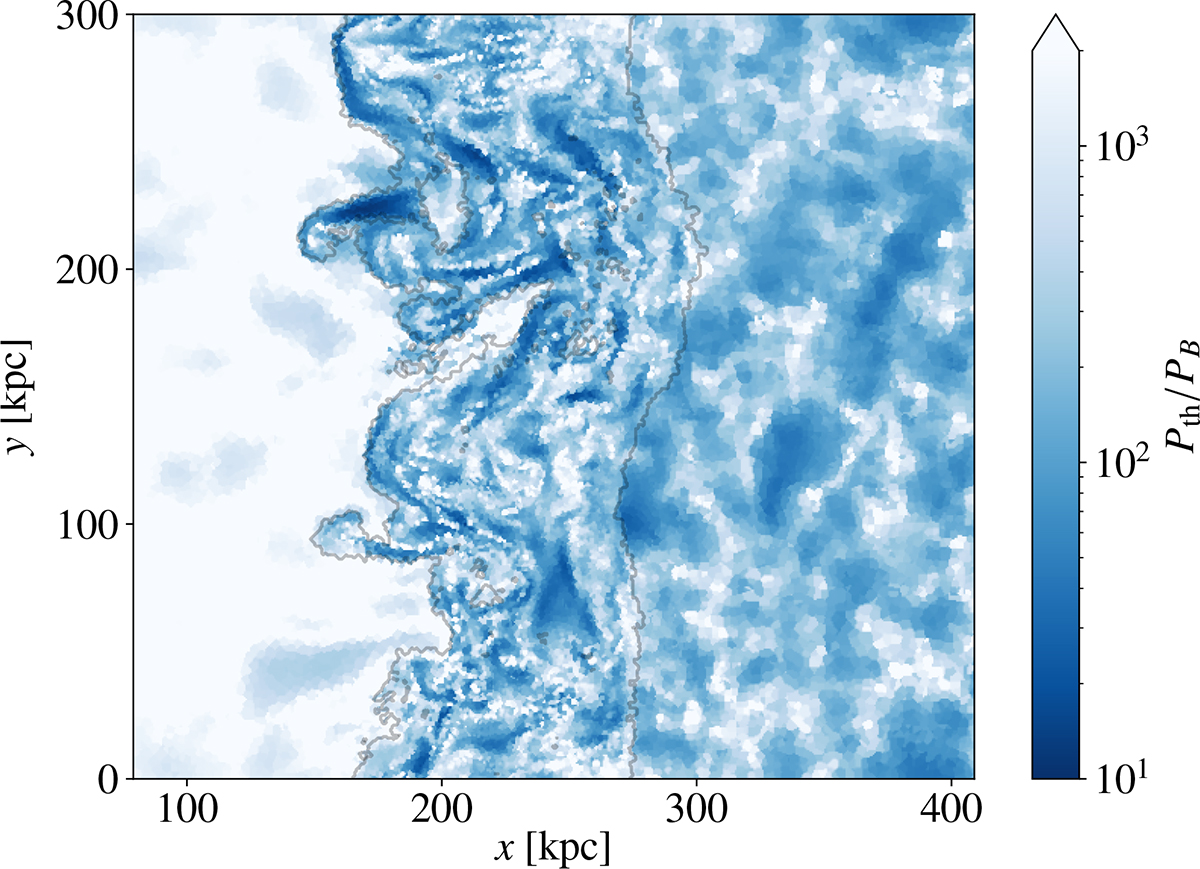
Fig. 8.
Download original image
Slices through our fiducial Mach 3 simulation at t = 180 Myr showing plasma beta values. The grey lines mark the corrugated shock surface and the contact discontinuity (i.e. the region within which tracers have been injected). Despite significant amplification, beta values are typically well above 10, limiting the ability of the magnetic field to affect dynamics.
Current usage metrics show cumulative count of Article Views (full-text article views including HTML views, PDF and ePub downloads, according to the available data) and Abstracts Views on Vision4Press platform.
Data correspond to usage on the plateform after 2015. The current usage metrics is available 48-96 hours after online publication and is updated daily on week days.
Initial download of the metrics may take a while.