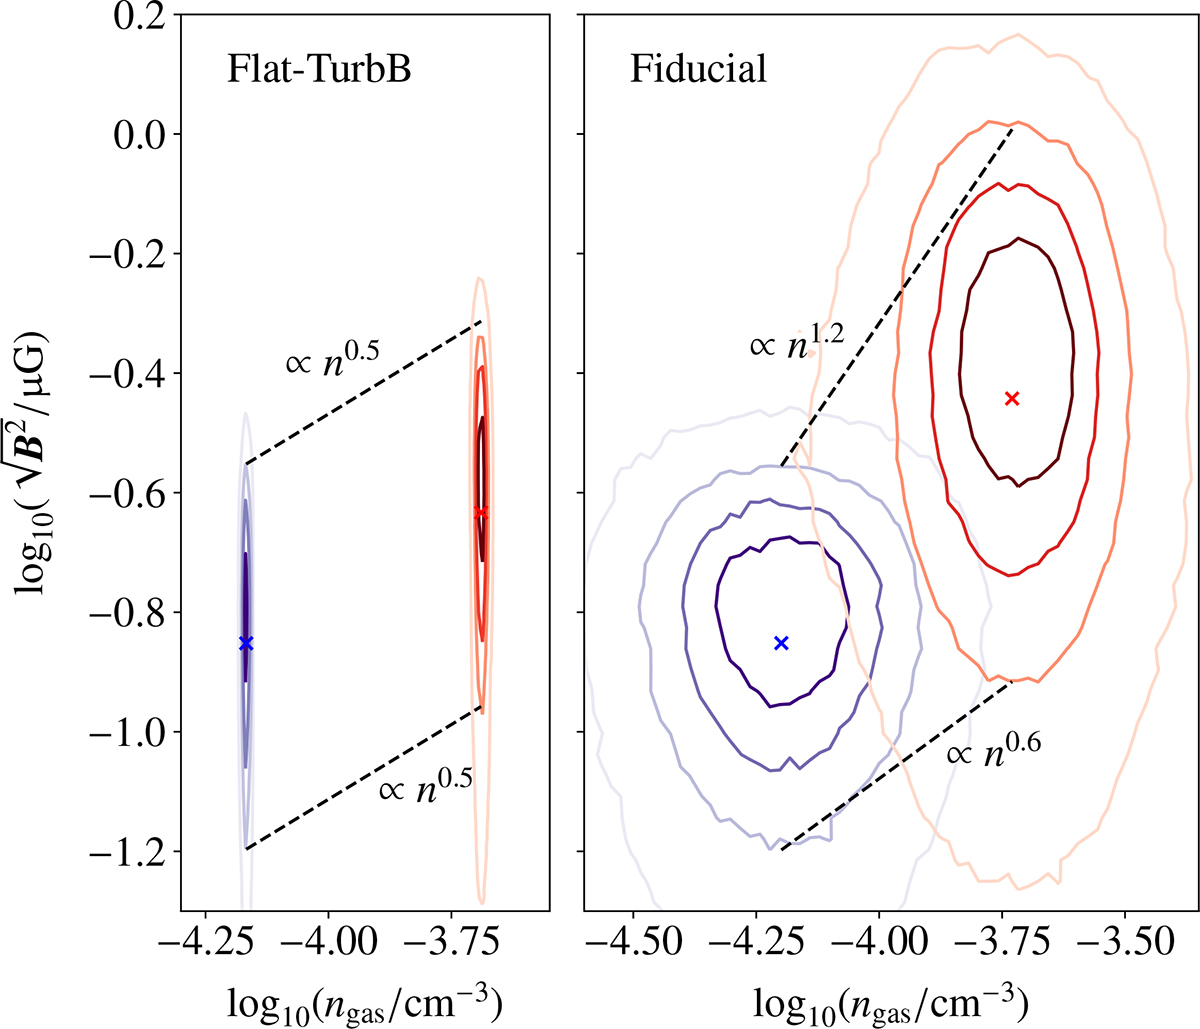
Fig. 9.
Download original image
Left: Phase space diagram of magnetic field strength versus gas number density for our Mach 3 Flat-TurbB simulation. Contours cover 25%, 50%, 75%, and 95% of the probability density (represented by darker to lighter shades, respectively). Blue colours indicate the initial upstream distribution, whilst red colours show the final state in the injected region at t = 250 Myr. A cross marks the median of the distribution. Right: As previous, except data are taken from the Mach 3 fiducial simulation. Dashed lines indicate the empirical scaling of the 75% boundaries. Amplification is weaker than the naive expectation for Flat-TurbB due to magnetic decay. Meanwhile, for the fiducial simulation, amplification is significantly stronger than that possible from compression alone.
Current usage metrics show cumulative count of Article Views (full-text article views including HTML views, PDF and ePub downloads, according to the available data) and Abstracts Views on Vision4Press platform.
Data correspond to usage on the plateform after 2015. The current usage metrics is available 48-96 hours after online publication and is updated daily on week days.
Initial download of the metrics may take a while.