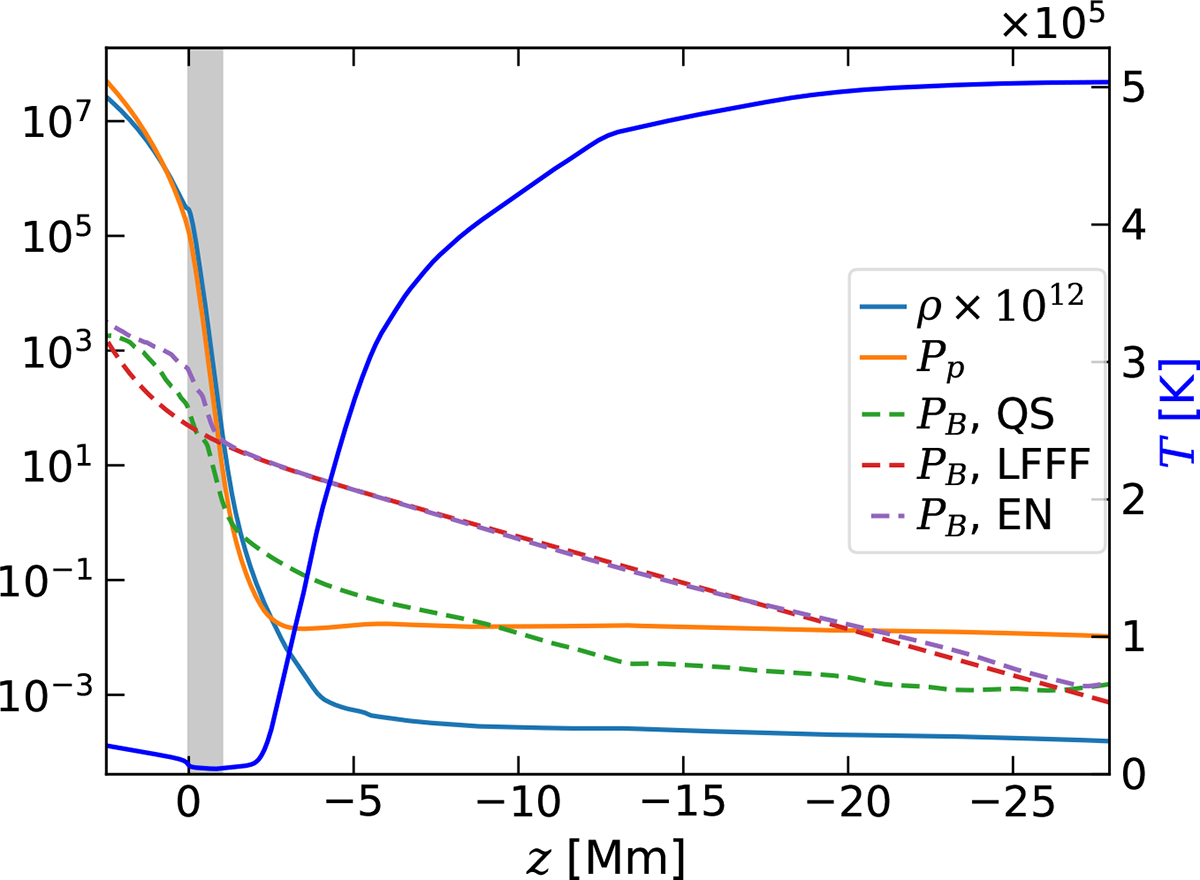
Fig. 1.
Download original image
Horizontal averages of the Bifrost simulation. The magnetic pressures (PB) are given in dyn/cm2 for the QS simulation before the ramp at snapshot 1000 (dashed green), for the time-independent LFFF (dashed red), and for the simulation after the ramp at snapshot 1120 (dashed purple). The pressure (orange), the density (light blue), and the temperature (dark blue) of the atmosphere are plotted at snapshot 1000. The density is given in g/cm3, multiplied with a factor 1012 to fit on the same axis as the magnetic pressures, while the temperature is given on the right axis. The shaded gray area (z ∈ [0, −1] Mm) represents the “thick” photosphere, up to the altitude of the temperature minimum, i.e., the height where the density stratification is the strongest (see Sect. 3.4 for more details).
Current usage metrics show cumulative count of Article Views (full-text article views including HTML views, PDF and ePub downloads, according to the available data) and Abstracts Views on Vision4Press platform.
Data correspond to usage on the plateform after 2015. The current usage metrics is available 48-96 hours after online publication and is updated daily on week days.
Initial download of the metrics may take a while.