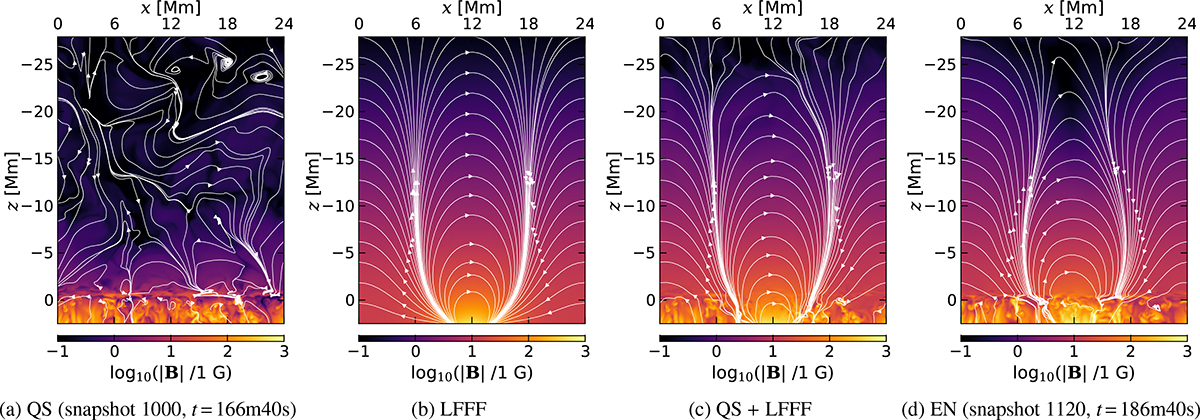
Fig. 2.
Download original image
2D cross sections of the magnetic field at y = 10 Mm. The streamlines show field lines, but their density does not signify the field strength. The field strength is shown by the color. (a) is the QS field right after the relaxation, (b) is the LFFF, (c) is the sum of the two proceeding, while (d) shows the EN right after the 20 min long ramp of the LFFF into the QS simulation.
Current usage metrics show cumulative count of Article Views (full-text article views including HTML views, PDF and ePub downloads, according to the available data) and Abstracts Views on Vision4Press platform.
Data correspond to usage on the plateform after 2015. The current usage metrics is available 48-96 hours after online publication and is updated daily on week days.
Initial download of the metrics may take a while.