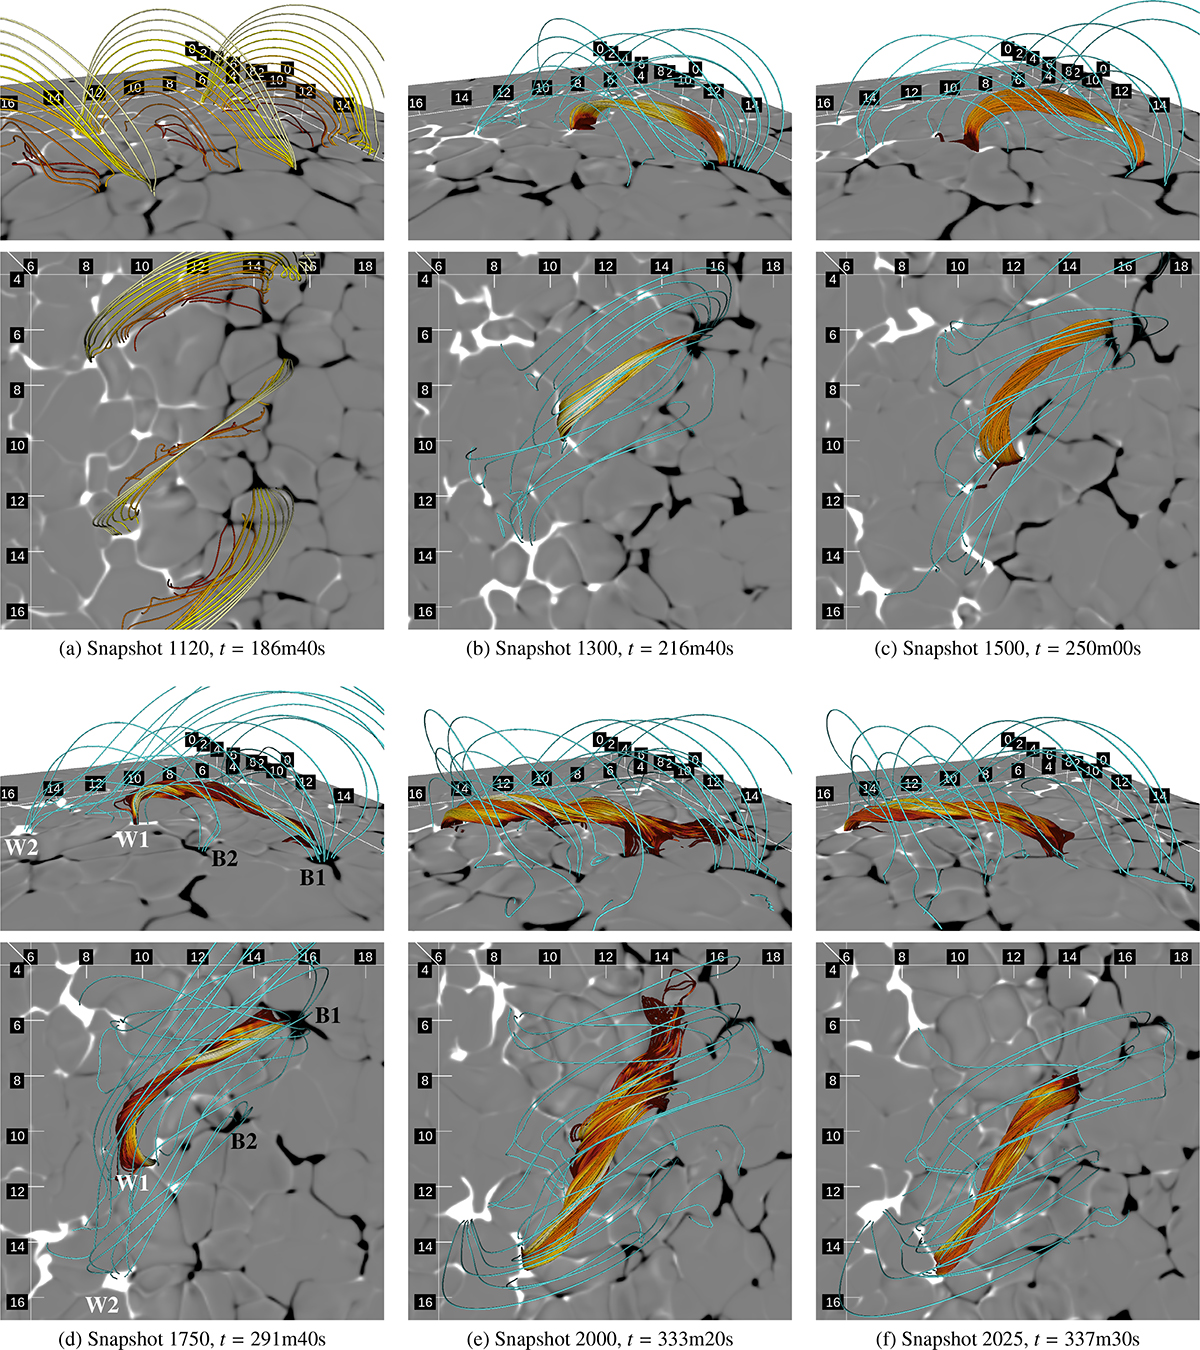
Fig. 4.
Download original image
Gradual formation and evolution of a flux rope in the Bifrost simulation. Each subfigure contains two panels, an angled view above a vertical top view of the same set of field lines. The angled views are identical in all subfigures, oriented such that the x axis increases down to the right and the y axis increases down to the left. The numbers on the axes are in units of Mm. (a) is right after the end of ramp of the LFFF, and differs from the rest by only showing field lines seeded at x = 12 Mm, y ∈ {5, 10, 15} Mm, and z ∈ (0, −5) Mm in gradually brighter colors. (b)–(f) show field lines representative for the flux rope in yellow-red colors, darker colors are shown for larger values of |J|/|B|, and overlying arcades in cyan. (d) also shows the four poles W1, W2, B1, and B2 referred to in the text.
Current usage metrics show cumulative count of Article Views (full-text article views including HTML views, PDF and ePub downloads, according to the available data) and Abstracts Views on Vision4Press platform.
Data correspond to usage on the plateform after 2015. The current usage metrics is available 48-96 hours after online publication and is updated daily on week days.
Initial download of the metrics may take a while.