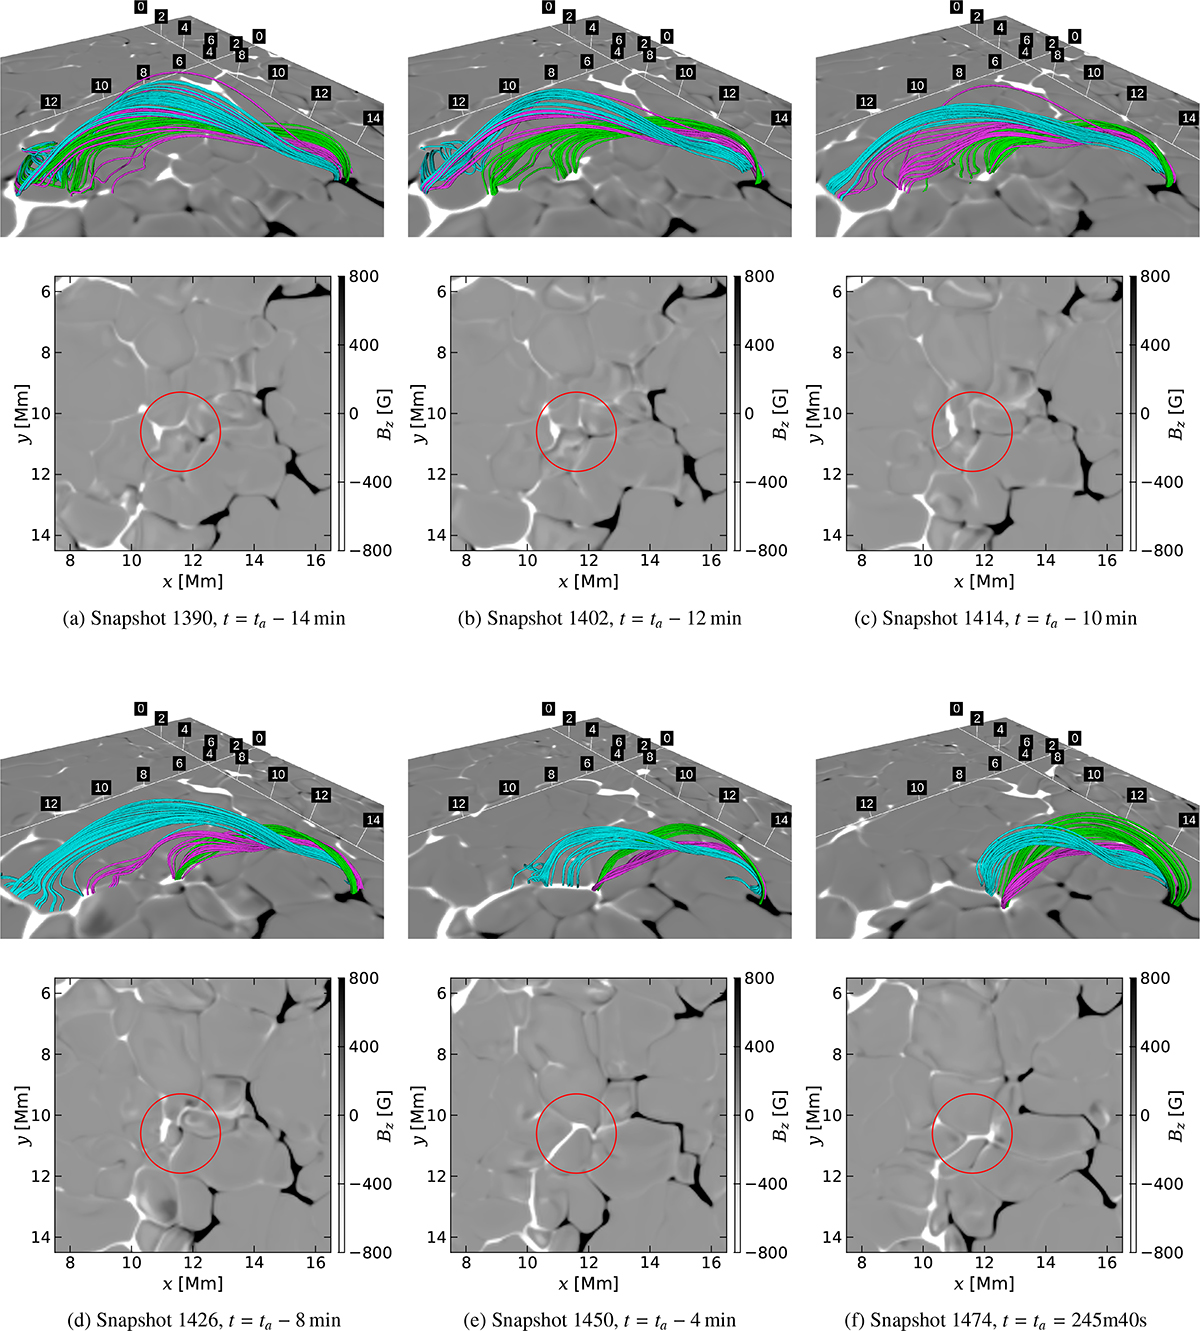
Fig. 5.
Download original image
Slipping reconnection in the Bifrost simulation. Combined, the subfigures labeled (a)–(f) show the evolution until the time ta = 245m40s when this slipping process is complete. Each subfigure contains a top panel with an angled view of three families of 3D field lines (cyan, green, magenta), tracked by corks, above a 2D magnetogram. The angled view is angled from the bottom right corner of the 2D magnetogram toward the top left corner. On the bottom of each subfigure is a panel with only the 2D magnetogram, seen from directly above. The red circles in the bottom panels of each subfigure all highlight the same area of interest.
Current usage metrics show cumulative count of Article Views (full-text article views including HTML views, PDF and ePub downloads, according to the available data) and Abstracts Views on Vision4Press platform.
Data correspond to usage on the plateform after 2015. The current usage metrics is available 48-96 hours after online publication and is updated daily on week days.
Initial download of the metrics may take a while.