Fig. 6.
Download original image
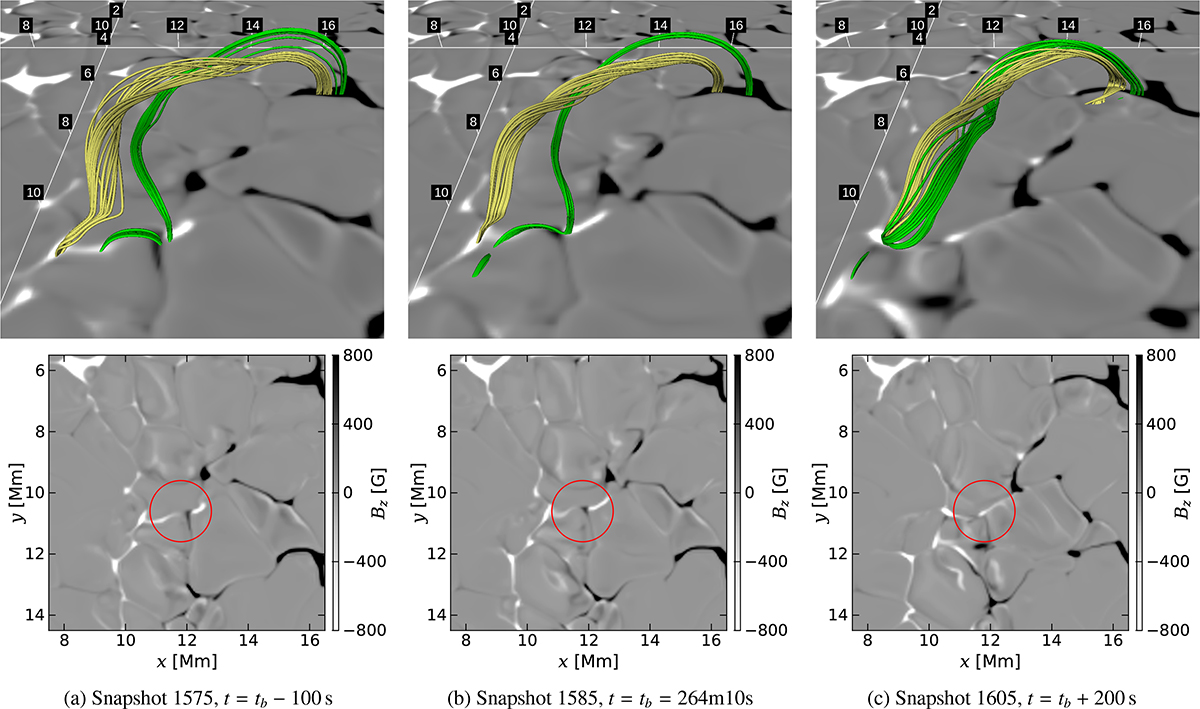
U-loop emergence in the Bifrost simulation. From left to right, there are three different times relative to tb, a representative time for the emergence: (a) 100 s earlier, (b) tb, (c) 200 s later, after the end of the relevant flux cancellation. The upper panels of each subfigure show the 3D field lines of interest in green, tracked by corks, and pale yellow field lines representing the core of the flux rope, above a 2D magnetogram. The view in the upper panels is angled toward lower y. The lower panels show the same 2D magnetogram, from directly above. The cancellation of interest occurs within the red circle.
Current usage metrics show cumulative count of Article Views (full-text article views including HTML views, PDF and ePub downloads, according to the available data) and Abstracts Views on Vision4Press platform.
Data correspond to usage on the plateform after 2015. The current usage metrics is available 48-96 hours after online publication and is updated daily on week days.
Initial download of the metrics may take a while.