Fig. 7.
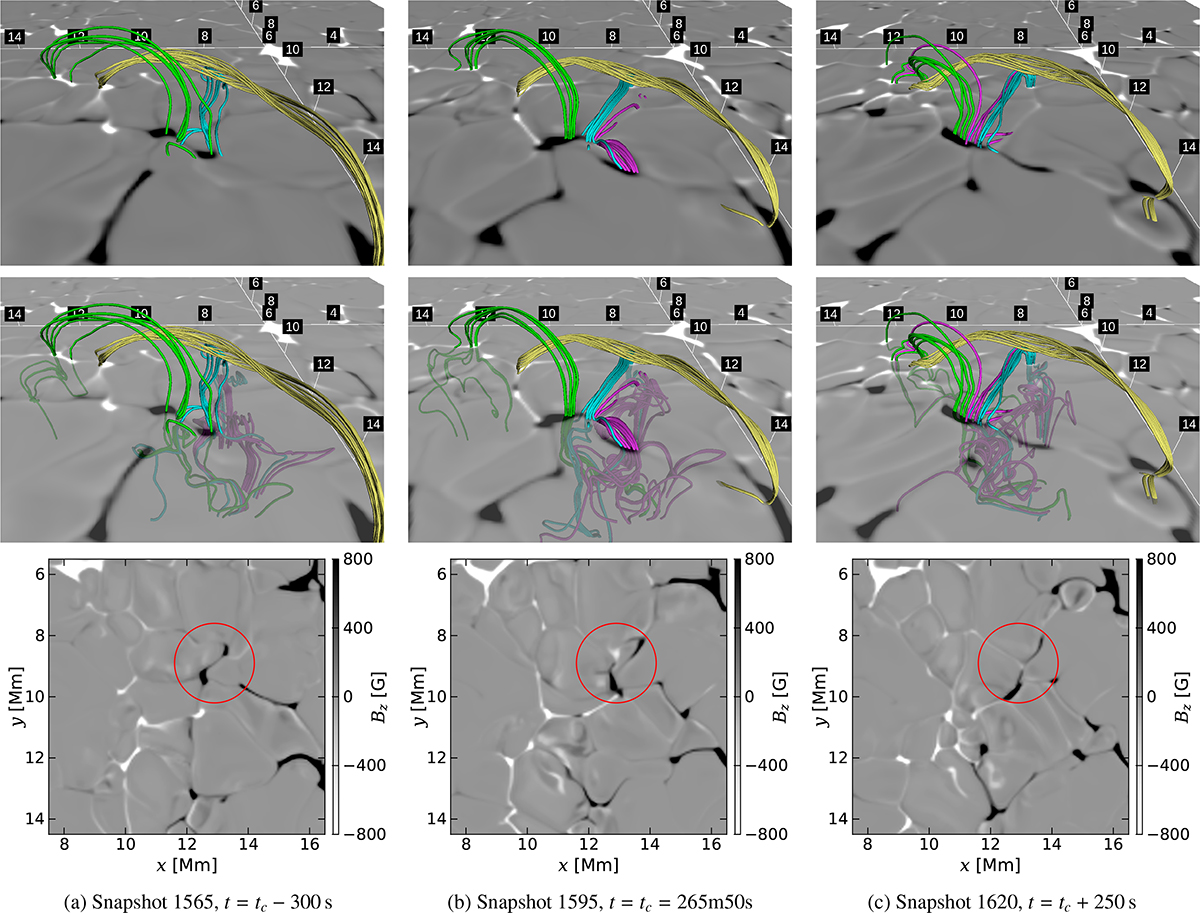
Download original image
Ω-loop submergence in the Bifrost simulation. From left to right, there are three different times relative to tc, a representative time for the submergence: (a) 300 s earlier, (b) tc, (c) 250 s later, after the end of the flux cancellation. The top panel of each subfigure shows three families of 3D field lines of interest in different colors (cyan, green, magenta), tracked by corks, and pale yellow field lines representing the core of the flux rope, above a 2D magnetogram. The middle panel shows the same, but with a partially transparent photospheric magnetogram, to reveal the field lines below the surface. The bottom panel shows only the 2D magnetogram, where the cancellation of interest occurs within the red circle. We stress that the two upper rows are viewed from the right, toward lower x, to better visualize the dynamics of interest.
Current usage metrics show cumulative count of Article Views (full-text article views including HTML views, PDF and ePub downloads, according to the available data) and Abstracts Views on Vision4Press platform.
Data correspond to usage on the plateform after 2015. The current usage metrics is available 48-96 hours after online publication and is updated daily on week days.
Initial download of the metrics may take a while.