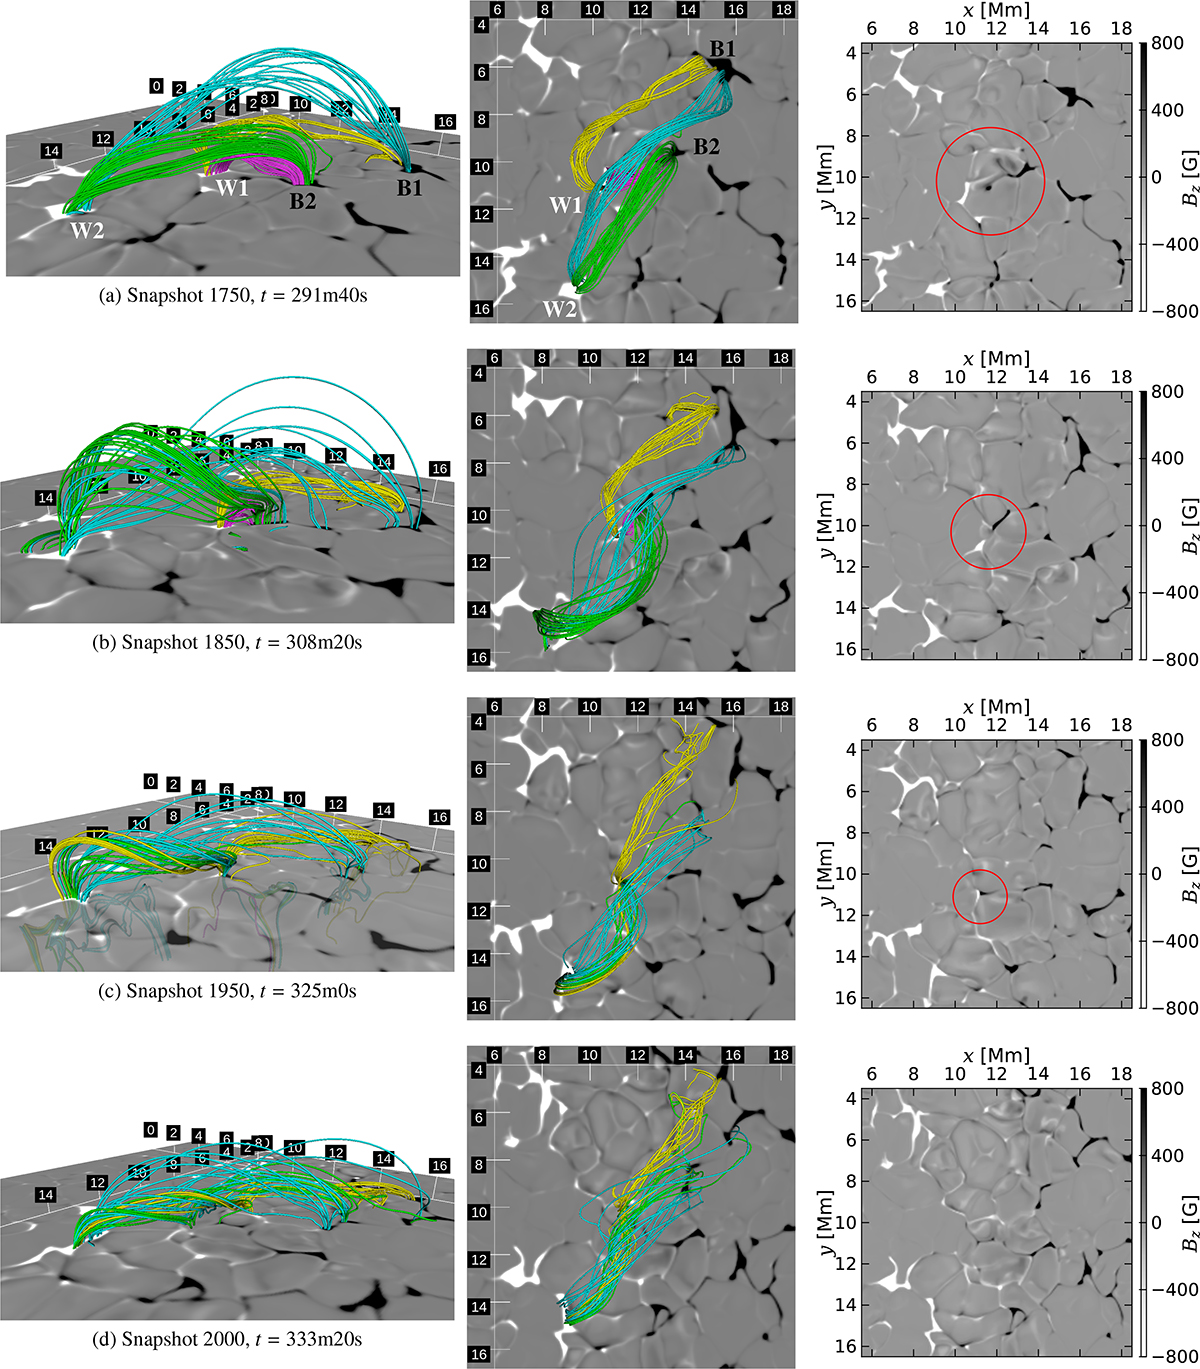
Fig. 8.
Download original image
TPTC reconnection in the Bifrost simulation. In this figure, time advances downward, unlike in the previous figures, while all three panels per subfigure row show different views of the same snapshot. The left panels show four families of 3D field lines of interest in different colors (cyan, green, magenta, yellow), tracked by corks, above a 2D magnetogram. The magnetogram in the left panel in (c) is transparent by choice to show the magenta field line below the surface. The middle panels show the same, but from directly above. The right panels show only the 2D magnetogram, from directly above, where the cancellation of interest occurs within the red circle. There is no red circle in (d) as the cancellation then has completed.
Current usage metrics show cumulative count of Article Views (full-text article views including HTML views, PDF and ePub downloads, according to the available data) and Abstracts Views on Vision4Press platform.
Data correspond to usage on the plateform after 2015. The current usage metrics is available 48-96 hours after online publication and is updated daily on week days.
Initial download of the metrics may take a while.