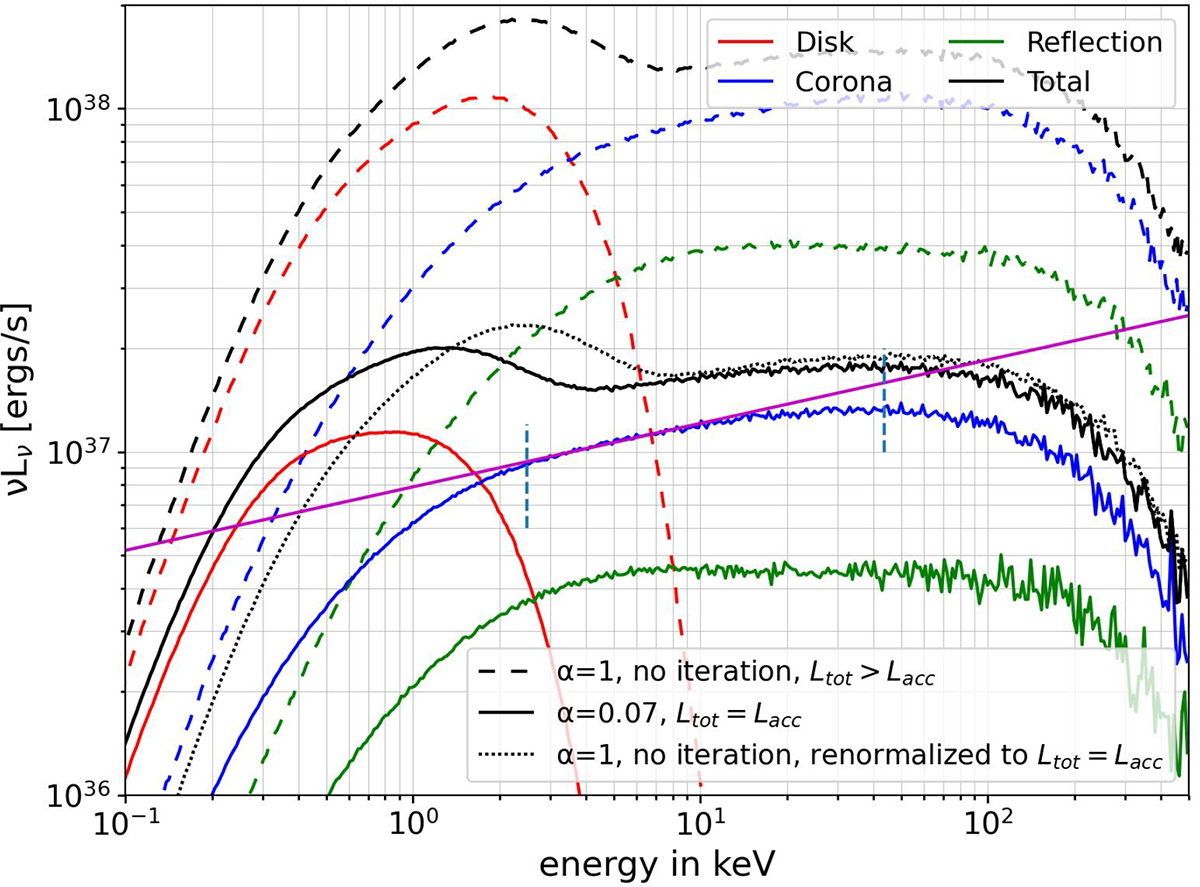
Fig. 2.
Download original image
Change in the observed spectrum at an inclination of 60° due to the imposition of global energy equilibrium (Ltot = Lacc). The coronal optical depth is fixed at 0.15, and all other parameters are set to their reference values as described in Section 3.1. Different spectral components are shown using distinct colors. The solid lines correspond to the equilibrium solution obtained through iteration of the disk dissipation fraction α, which converges to a value of 0.07. The dashed lines represent the case with α = 1, where no iteration is performed and the equilibrium condition Ltot = Lacc is not enforced. The dotted black line shows the total spectrum for the α = 1 case, but renormalized such that Ltot = Lacc. The solid magenta line represents a power law fit to the scattered spectrum of the equilibrium solution, yielding a photon index of 1.82. The two vertical lines mark the energy range of 2.5−43.7 keV over which the power law fit is performed.
Current usage metrics show cumulative count of Article Views (full-text article views including HTML views, PDF and ePub downloads, according to the available data) and Abstracts Views on Vision4Press platform.
Data correspond to usage on the plateform after 2015. The current usage metrics is available 48-96 hours after online publication and is updated daily on week days.
Initial download of the metrics may take a while.