Fig. 1.
Download original image
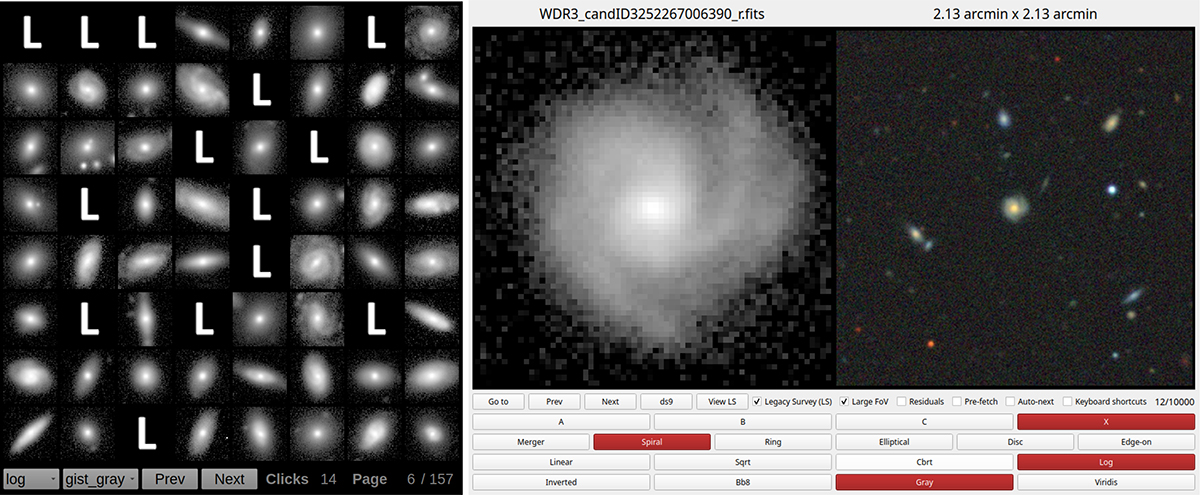
Visualisation tools used for the visual inspections. Left panel: Mosaic tool showing an 8 × 8 grid whilst highlighting sources classified as ‘lenses’ with a capitalised ‘L’ instead of the UNIONS stamp. Right panel: One-by-one sequential tool showing a spiral galaxy on the left side and the larger field of view from Legacy Survey on the right side. The source is classified as a ‘non-lens’ and further sub-classified as a ‘spiral’. Both applications are using logarithmic scale and a grey colour-map for the UNIONS stamps.
Current usage metrics show cumulative count of Article Views (full-text article views including HTML views, PDF and ePub downloads, according to the available data) and Abstracts Views on Vision4Press platform.
Data correspond to usage on the plateform after 2015. The current usage metrics is available 48-96 hours after online publication and is updated daily on week days.
Initial download of the metrics may take a while.