Fig. 2.
Download original image
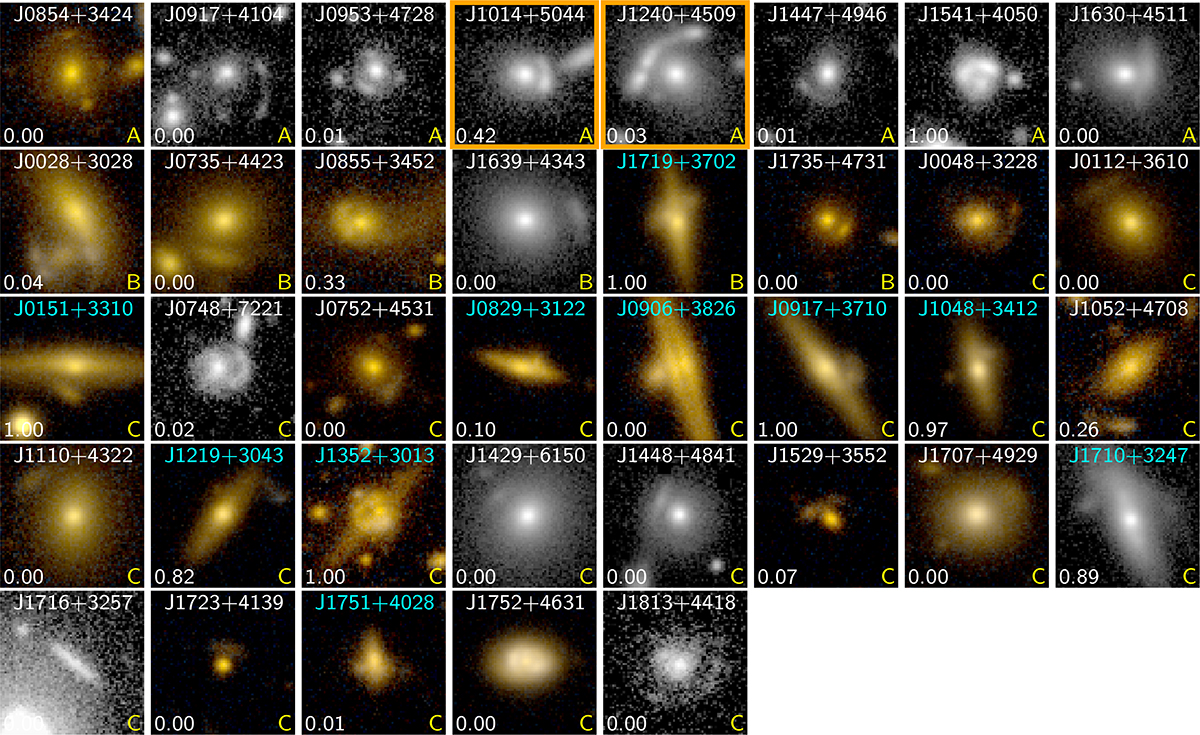
Lens candidates discovered during the prevalence study sorted by visual inspection grade and right ascension. We show a colour composite of the r- and u-bands when the u-band data are available, otherwise we just display a grey scale r-band image. The number in the bottom left is the CNN score, and the letter in the bottom right corresponds to the final human classification. We highlight the edge-on lenses with their name in cyan, and the candidates previously reported in the Strong Lens Database (SLED) with an overlaid orange square.
Current usage metrics show cumulative count of Article Views (full-text article views including HTML views, PDF and ePub downloads, according to the available data) and Abstracts Views on Vision4Press platform.
Data correspond to usage on the plateform after 2015. The current usage metrics is available 48-96 hours after online publication and is updated daily on week days.
Initial download of the metrics may take a while.