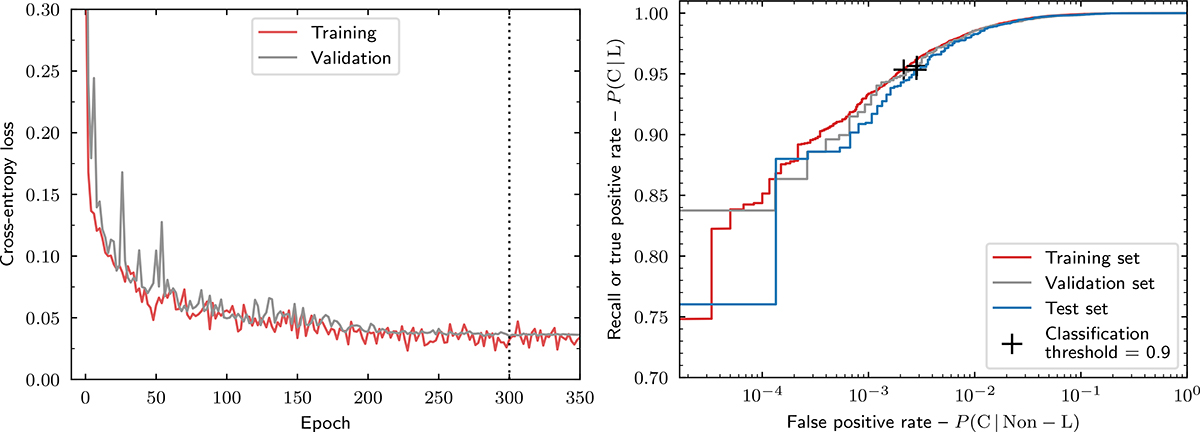
Fig. 4.
Download original image
Validation metrics for our training of CMUDeeplens. All the datasets are balanced. Left: Minimisation of the loss function during training. The dotted line marks the epoch with the best validation loss. Right: Receiver operating characteristic (ROC) curves for the selected model. The area under the curve is 0.9993, 0.9992, and 0.9992 for the training, validation, and test datasets, respectively. The ‘+’ marks the values at the classification threshold 0.9.
Current usage metrics show cumulative count of Article Views (full-text article views including HTML views, PDF and ePub downloads, according to the available data) and Abstracts Views on Vision4Press platform.
Data correspond to usage on the plateform after 2015. The current usage metrics is available 48-96 hours after online publication and is updated daily on week days.
Initial download of the metrics may take a while.