Fig. 5.
Download original image
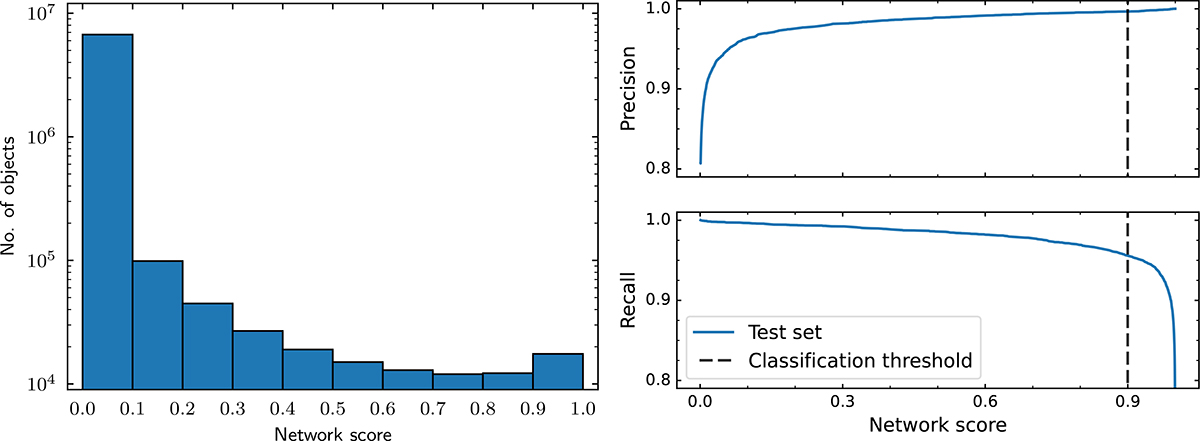
Left: Histogram in logarithmic scale of the distribution of network scores for the full parent sample. Only 17 514 of the sources had a score greater than 0.9. Right: Precision and recall versus network score for the test dataset. The dashed line marks the classification threshold applied on the parent sample, 0.9. We balanced the precision, recall, and number of sources selected to settle on a classification threshold.
Current usage metrics show cumulative count of Article Views (full-text article views including HTML views, PDF and ePub downloads, according to the available data) and Abstracts Views on Vision4Press platform.
Data correspond to usage on the plateform after 2015. The current usage metrics is available 48-96 hours after online publication and is updated daily on week days.
Initial download of the metrics may take a while.