Fig. 6.
Download original image
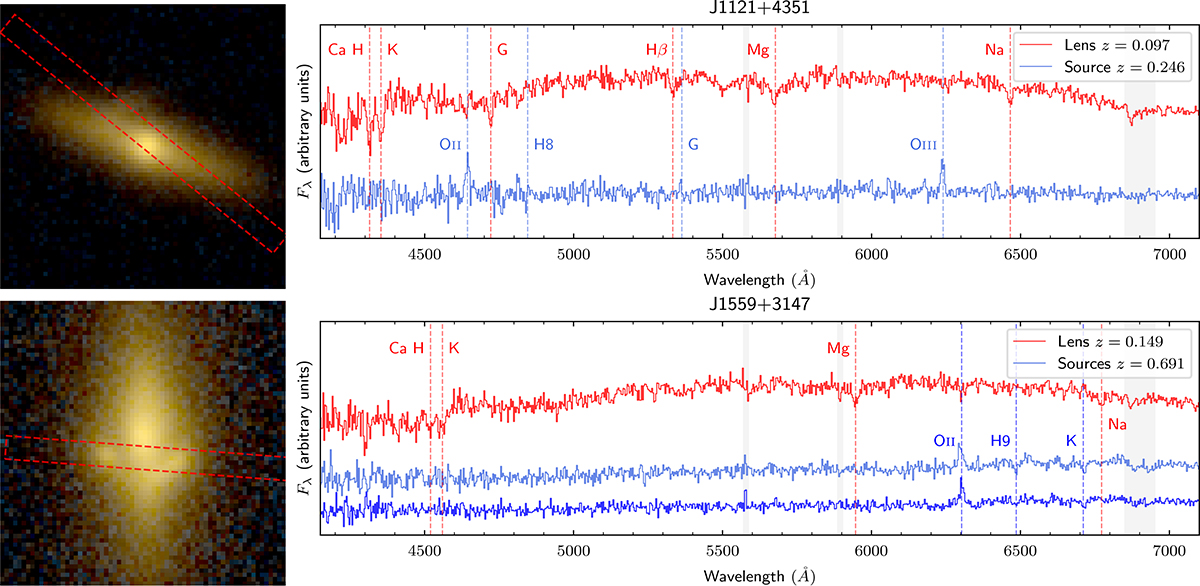
Follow-up observations for J1121+4351 and J1559+3147. Left: UNIONS r-band and u-band imaging of the lens candidates. The red dashed line represents the slit position. Right: Reduced 1D spectra from long-slit spectroscopy taken with the Alhambra Faint Object Spectrograph and Camera (ALFOSC) instrument in the NOT. The grey-shaded area marks atmospheric absorption bands. Spectral lines are highlighted with vertical dashed lines.
Current usage metrics show cumulative count of Article Views (full-text article views including HTML views, PDF and ePub downloads, according to the available data) and Abstracts Views on Vision4Press platform.
Data correspond to usage on the plateform after 2015. The current usage metrics is available 48-96 hours after online publication and is updated daily on week days.
Initial download of the metrics may take a while.