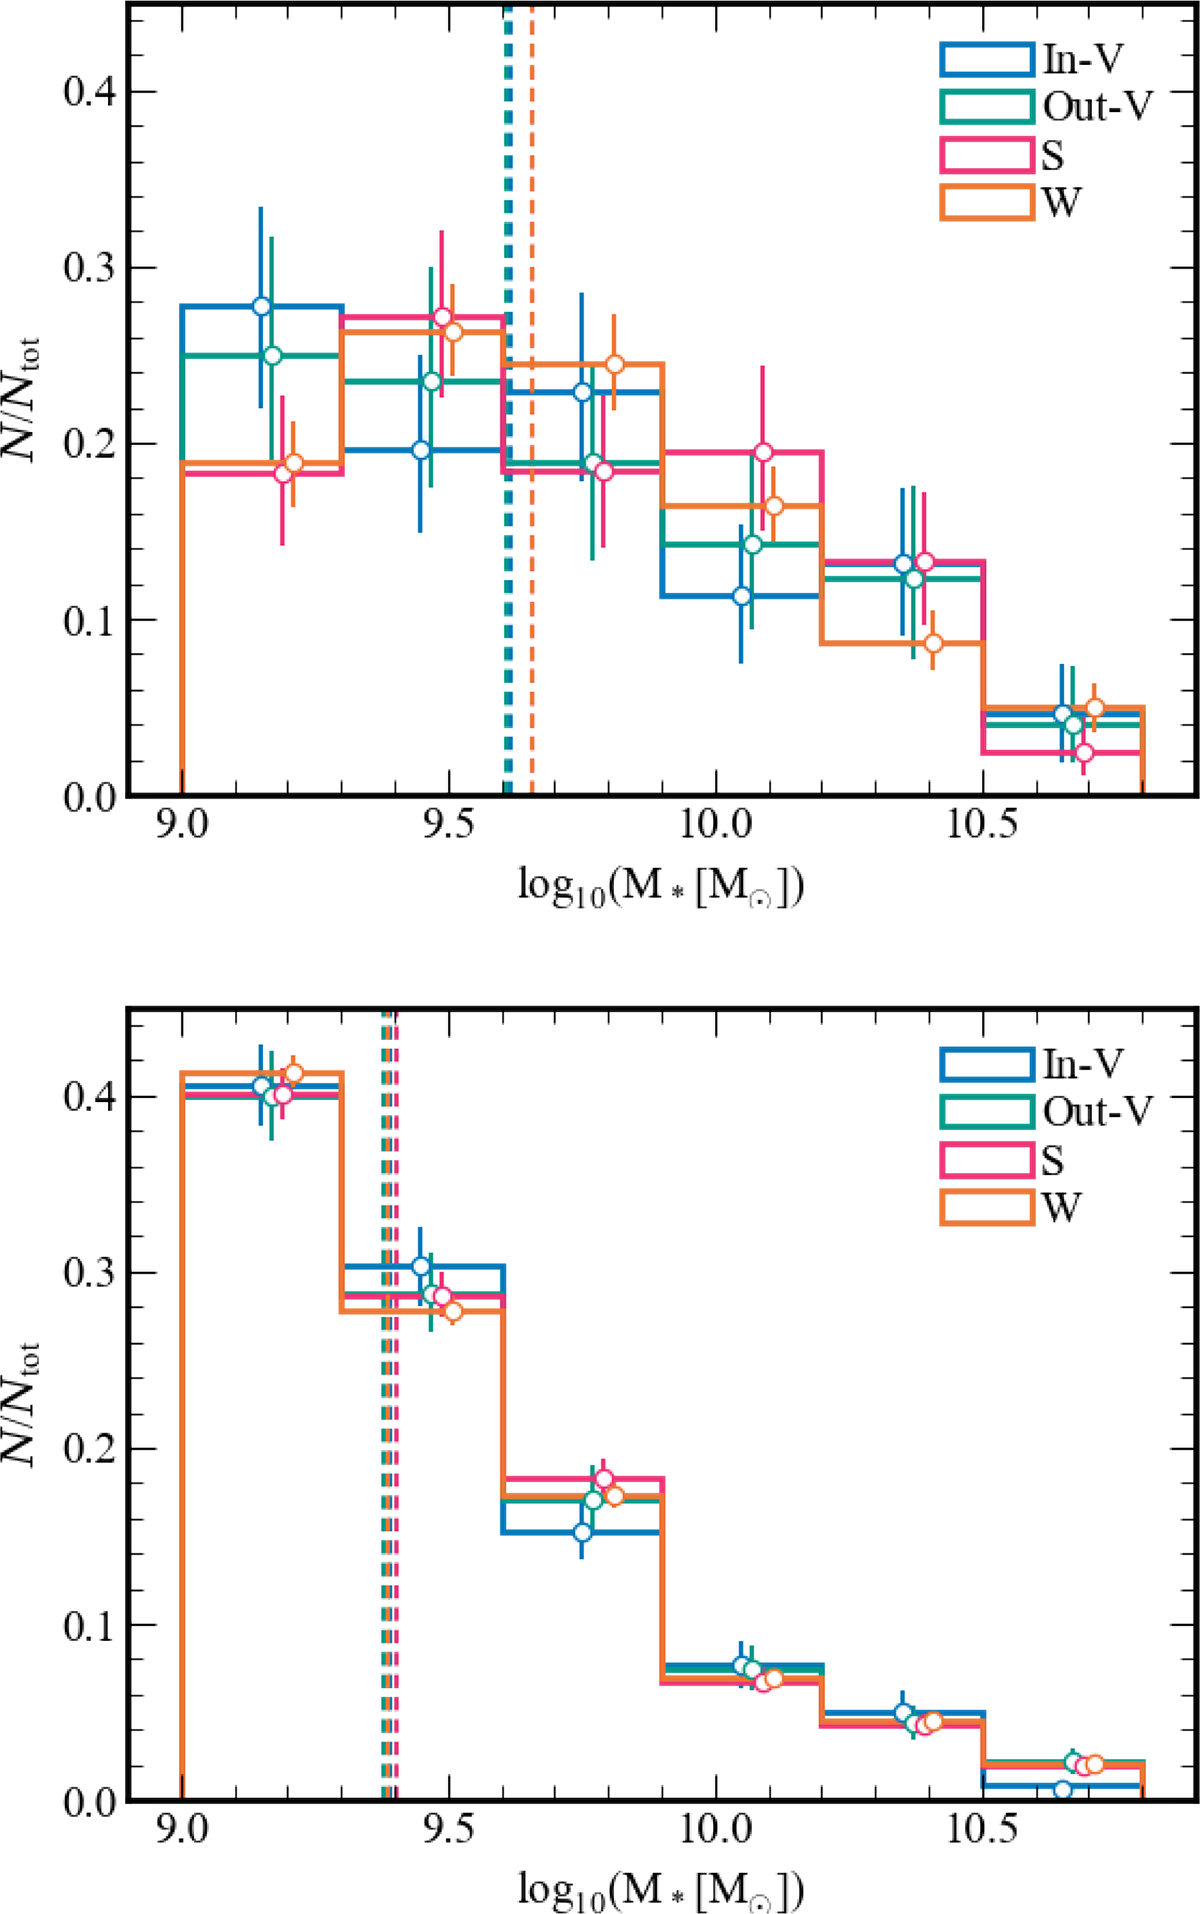
Fig. 1.
Download original image
Stellar mass distribution of the AGN (top panel) and the non-AGN galaxies (bottom panel) in the inner void (blue), outer void (green), skeleton (magenta), and wall (orange) cosmic environments. The vertical lines denote the median stellar mass for each environment. We note that the AGN and non-AGN samples have been drawn from galaxy samples in each environment that have matching stellar mass distributions (Rosas-Guevara et al. 2022). Error bars show the 16th and 84th percentiles from the bootstrap distribution of 1000 samples.
Current usage metrics show cumulative count of Article Views (full-text article views including HTML views, PDF and ePub downloads, according to the available data) and Abstracts Views on Vision4Press platform.
Data correspond to usage on the plateform after 2015. The current usage metrics is available 48-96 hours after online publication and is updated daily on week days.
Initial download of the metrics may take a while.