Fig. 3.
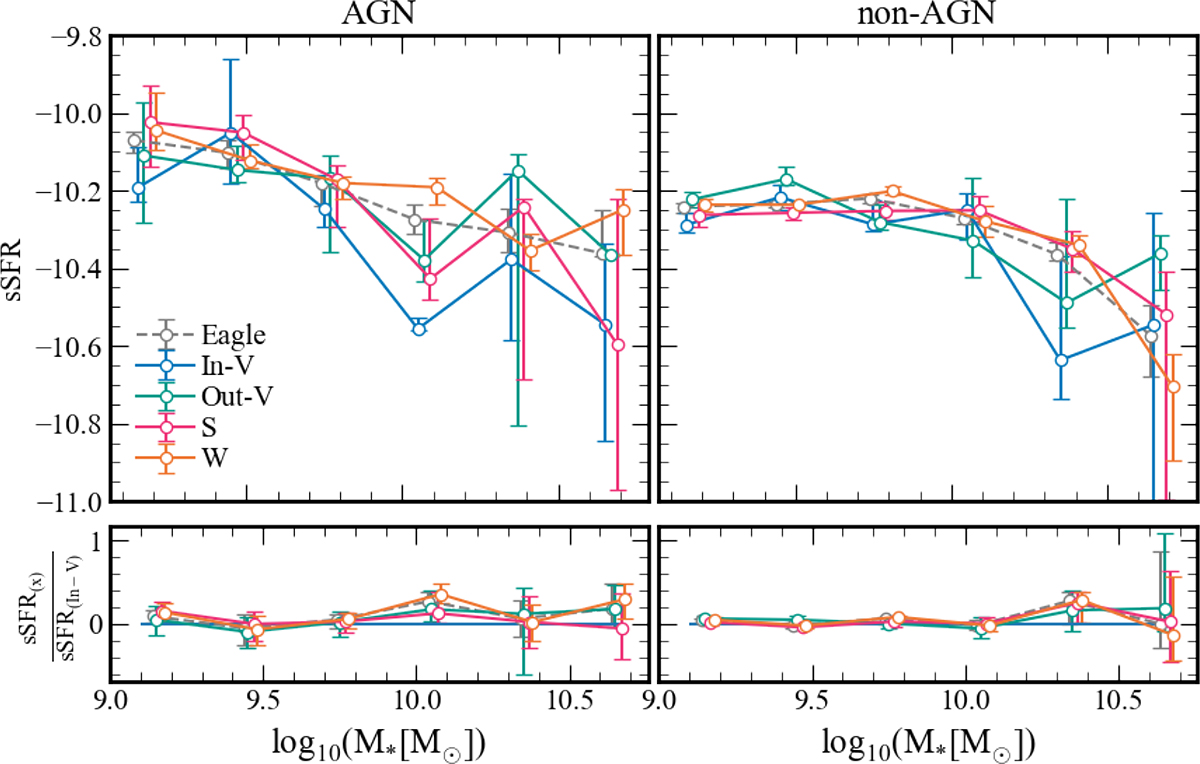
Download original image
Top: Log sSFR as a function of stellar mass for AGN (left) and non-AGN (right). The circle points are the median value of the log sSFR in that stellar mass range. The error bars denote the bootstrap errors in each stellar mass interval. Each point has been slightly shifted along the x-axis so that the error bars are visible. Bottom left: Ratio between the log sSFR of Out-V, S, W, and all AGN host galaxies to In-V. Bottom right: Ratio between the log sSFR of Out-V, S, W, and all non-AGN host galaxies to In-V (see Section 2.4 for definitions).
Current usage metrics show cumulative count of Article Views (full-text article views including HTML views, PDF and ePub downloads, according to the available data) and Abstracts Views on Vision4Press platform.
Data correspond to usage on the plateform after 2015. The current usage metrics is available 48-96 hours after online publication and is updated daily on week days.
Initial download of the metrics may take a while.