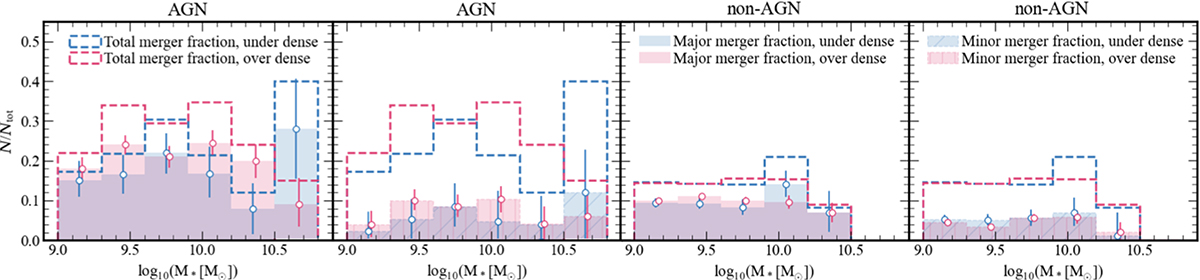
Fig. 9.
Download original image
Total (dashed lines), major (shaded areas), and minor (hatched shading) merger fraction as a function of M* for AGN (left two panels) and non-AGN (right two panels) host galaxies in under-dense (blue lines and shades) and over-dense (magenta lines and shades) environments at z = 0. The solid shaded regions in the left panels represent major mergers, while the dashed lines indicate the total merger fraction within each stellar mass bin. The hatched shaded regions in the right panels correspond to the minor mergers. Error bars show the 16th and 84th percentiles from the bootstrap distribution of 1000 samples. We also tested jackknife errors and found that the bootstrap errors were larger.
Current usage metrics show cumulative count of Article Views (full-text article views including HTML views, PDF and ePub downloads, according to the available data) and Abstracts Views on Vision4Press platform.
Data correspond to usage on the plateform after 2015. The current usage metrics is available 48-96 hours after online publication and is updated daily on week days.
Initial download of the metrics may take a while.