Fig. 11
Download original image
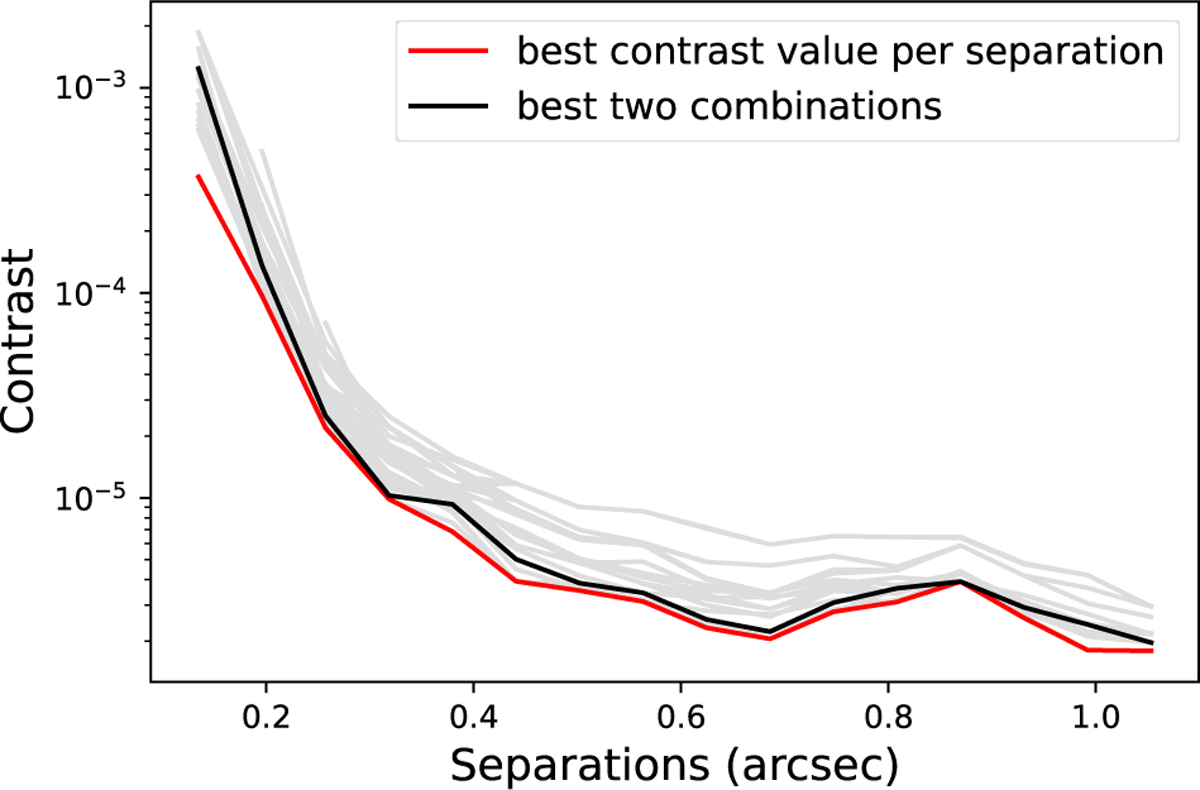
Optimal contrast curve achieved by different combinations of PSF subtraction techniques in RSM. Gray curves show the median contrast performance for each combination, computed across all datasets in cluster 1. The red curve highlights the best achievable performance at each separation, given by the median of the minimum contrast values across all combinations. The black curve shows the median of the maximum contrast values delivered by the two best-performing combinations: APCA-NMF-LOCI-FMKLIP and APCA-LOCI-FMKLIP.
Current usage metrics show cumulative count of Article Views (full-text article views including HTML views, PDF and ePub downloads, according to the available data) and Abstracts Views on Vision4Press platform.
Data correspond to usage on the plateform after 2015. The current usage metrics is available 48-96 hours after online publication and is updated daily on week days.
Initial download of the metrics may take a while.