Fig. 12
Download original image
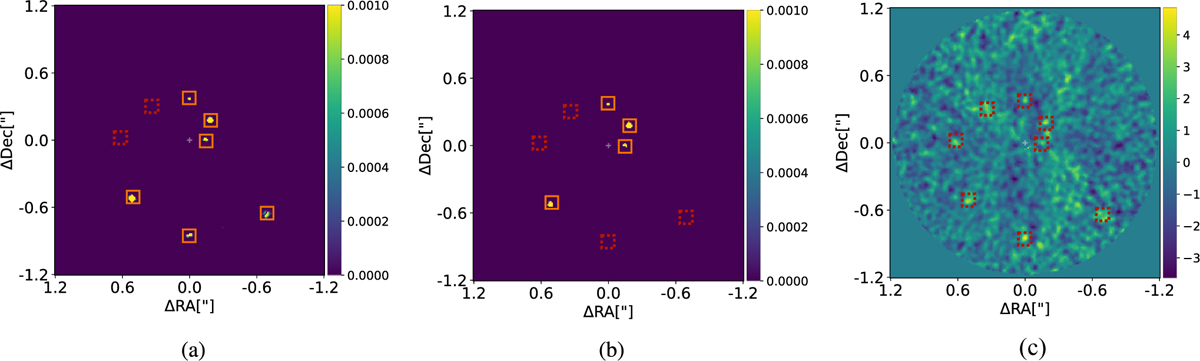
Comparison of recovered fake point sources in cluster center 1 using RSM maps with different PSF subtraction technique combinations: (a) APCA-NMF-LOCI-FMKLIP and (b) APCA-LOCI-FMKLIP, compared to the signal-to-noise ratio PCA map with five principal components (c). The RSM maps shown in this figure are thresholded (RSM map minus the separation-dependent threshold). Injected signals recovered above the detection threshold are marked with yellow squares, while unrecovered signals appear in red squares.
Current usage metrics show cumulative count of Article Views (full-text article views including HTML views, PDF and ePub downloads, according to the available data) and Abstracts Views on Vision4Press platform.
Data correspond to usage on the plateform after 2015. The current usage metrics is available 48-96 hours after online publication and is updated daily on week days.
Initial download of the metrics may take a while.