Fig. 14
Download original image
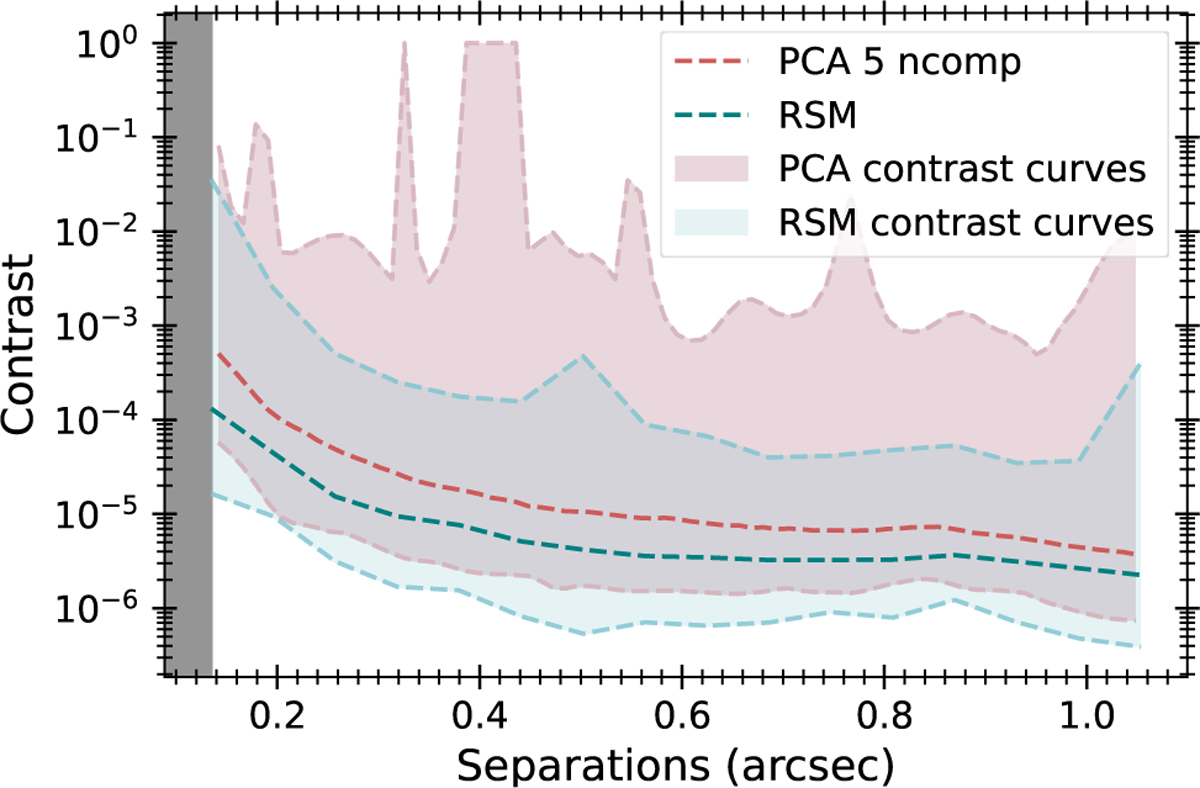
Comparison of RSM and full-frame PCA contrast curves for the F150 SHINE sample. The illustration provides a visualization of all RSM contrast curves (shaded blue) and PCA contrast curves (shaded pink), including their median values, highlighting RSM’s significant improvement in detection limits at both small and large separations.
Current usage metrics show cumulative count of Article Views (full-text article views including HTML views, PDF and ePub downloads, according to the available data) and Abstracts Views on Vision4Press platform.
Data correspond to usage on the plateform after 2015. The current usage metrics is available 48-96 hours after online publication and is updated daily on week days.
Initial download of the metrics may take a while.