Open Access
Fig. 16
Download original image
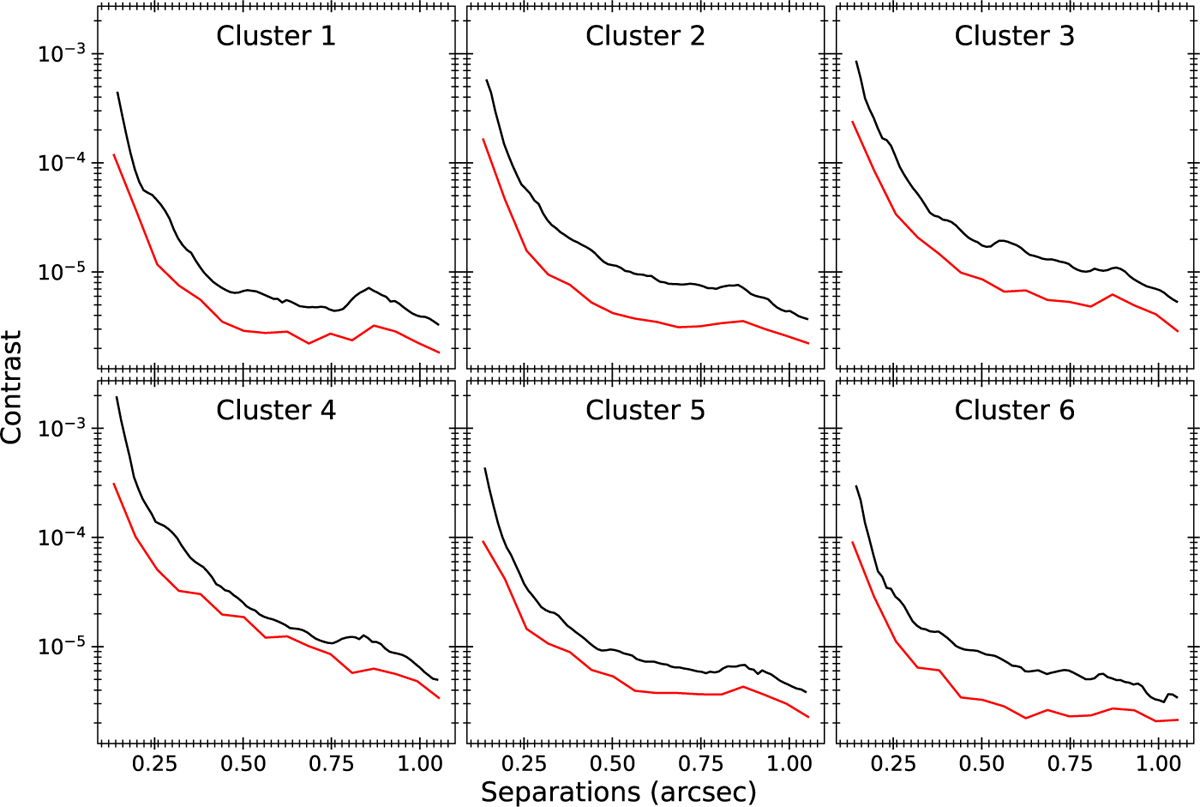
Contrast performance improvements of RSM across various observing conditions in the SHINE survey clusters: median contrast curves are shown in red for RSM and black for PCA, demonstrating RSM’s superior efficiency overall.
Current usage metrics show cumulative count of Article Views (full-text article views including HTML views, PDF and ePub downloads, according to the available data) and Abstracts Views on Vision4Press platform.
Data correspond to usage on the plateform after 2015. The current usage metrics is available 48-96 hours after online publication and is updated daily on week days.
Initial download of the metrics may take a while.