Fig. 19
Download original image
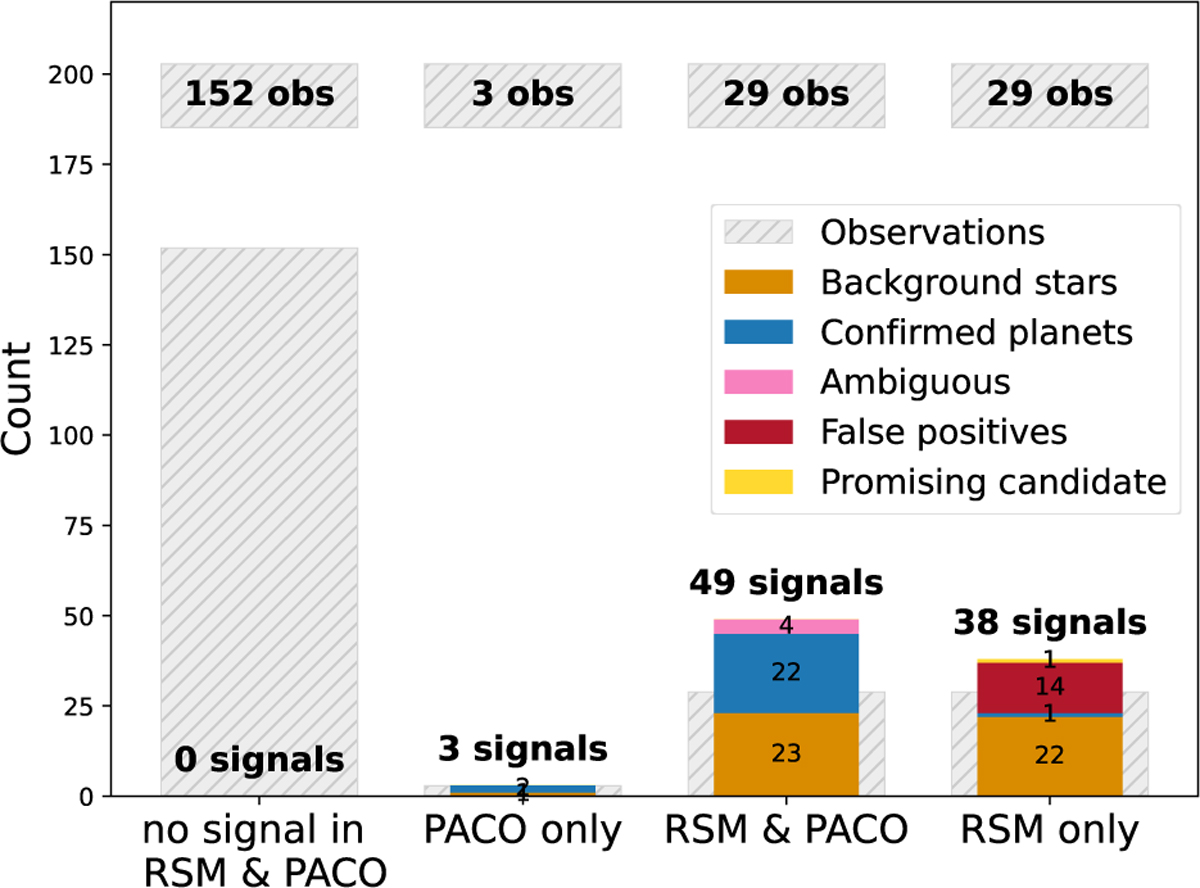
Summary of the detection statistics for the F150 sample, comparing the outcomes of RSM and PACO across four cases: no signal in either method, signal in PACO only, signal recovered by both methods, and signal recovered by RSM only. The dashed gray bars indicate the number of observations in each category, with the corresponding counts labeled above them. The colored stacked bars represent the number of detected signals, with colors denoting their classification: confirmed planets, background stars, ambiguous sources, false positives, and the newly identified promising candidate.
Current usage metrics show cumulative count of Article Views (full-text article views including HTML views, PDF and ePub downloads, according to the available data) and Abstracts Views on Vision4Press platform.
Data correspond to usage on the plateform after 2015. The current usage metrics is available 48-96 hours after online publication and is updated daily on week days.
Initial download of the metrics may take a while.