Open Access
Fig. G.1
Download original image
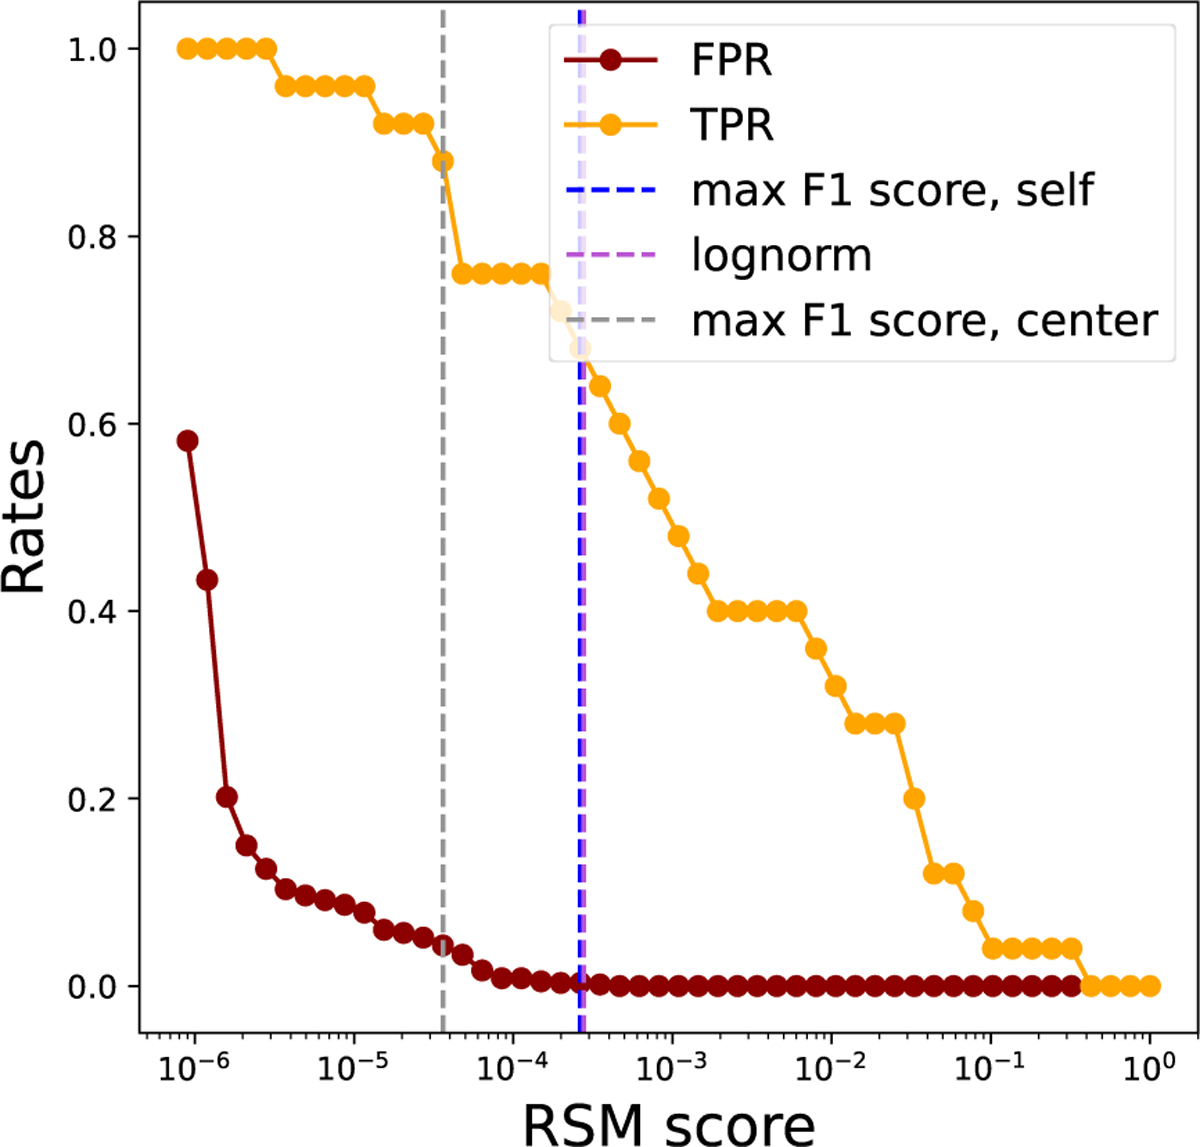
Maximum F1 score threshold for the cluster center 1 BD-15 705 (in pink) applied on the HIP 92680 dataset, in comparison to the maximum F1 score computed by the dataset HIP 92680 itself denoted as “self" (in cyan) and the lognormal threshold (in dark blue) done by the cluster 1, at separation 0″.55.
Current usage metrics show cumulative count of Article Views (full-text article views including HTML views, PDF and ePub downloads, according to the available data) and Abstracts Views on Vision4Press platform.
Data correspond to usage on the plateform after 2015. The current usage metrics is available 48-96 hours after online publication and is updated daily on week days.
Initial download of the metrics may take a while.