Open Access
Fig. H.1
Download original image
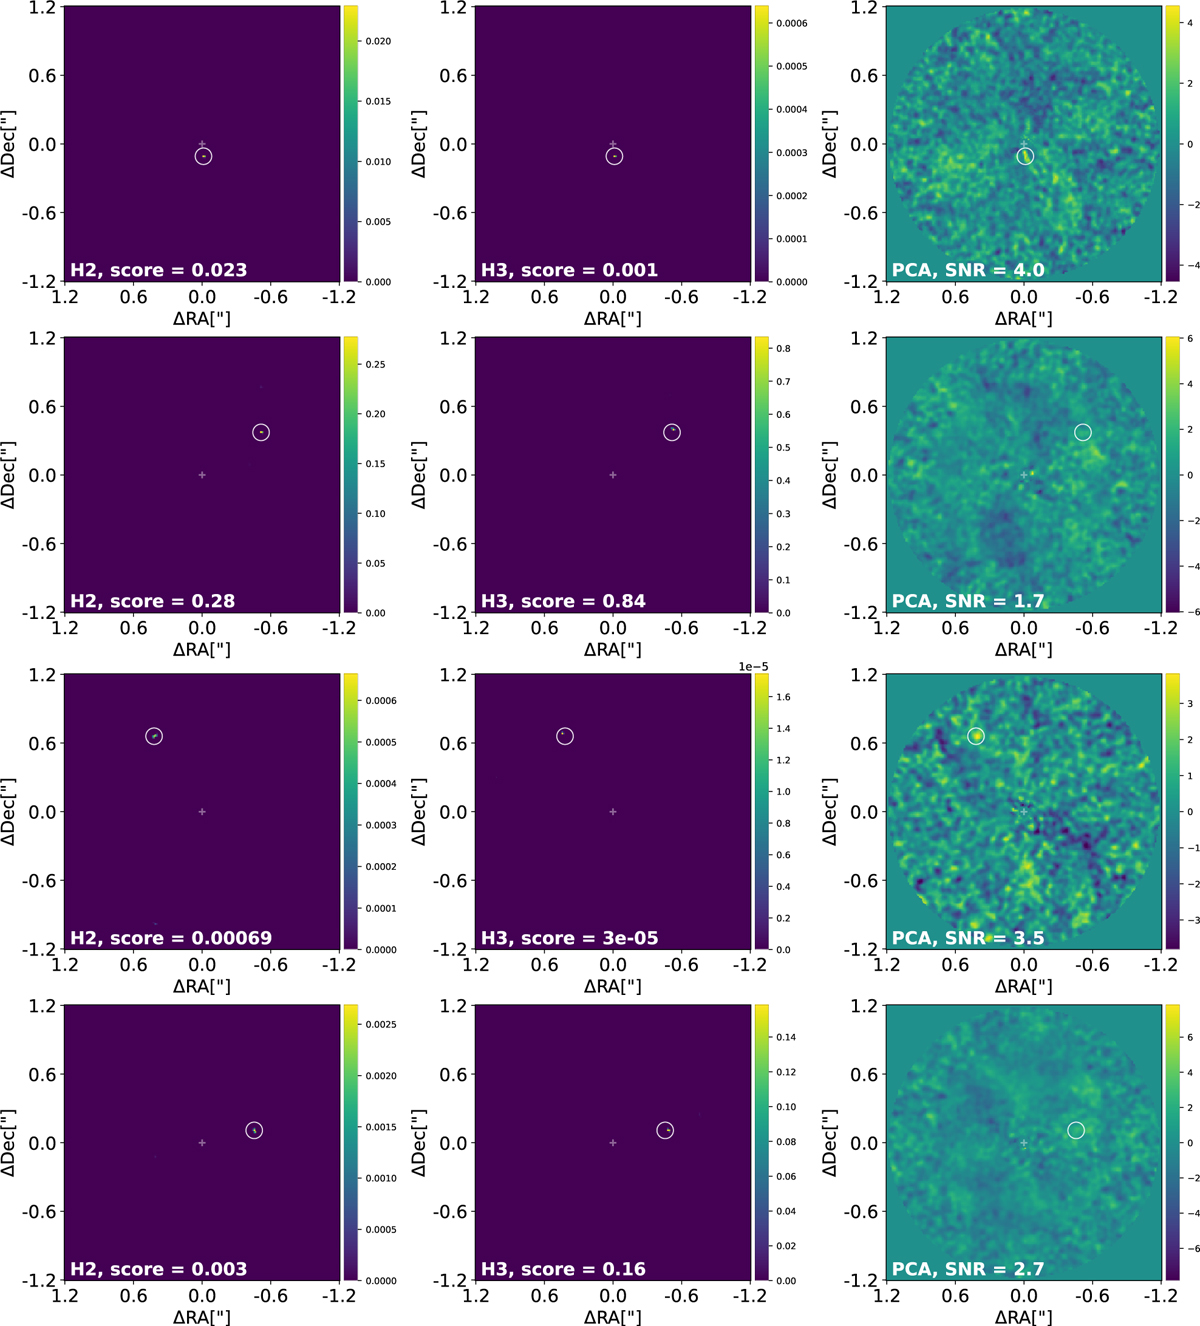
Comparison of RSM and PCA S/N maps for several newly identified background stars. Left and middle column panels: RSM maps generated with the APCA-NMF-LOCI-FMKLIP combination in the H2 and H3 filters, along with their corresponding RSM scores. Right column panels: PCA S/N maps computed with five components.
Current usage metrics show cumulative count of Article Views (full-text article views including HTML views, PDF and ePub downloads, according to the available data) and Abstracts Views on Vision4Press platform.
Data correspond to usage on the plateform after 2015. The current usage metrics is available 48-96 hours after online publication and is updated daily on week days.
Initial download of the metrics may take a while.