Open Access
Fig. 4
Download original image
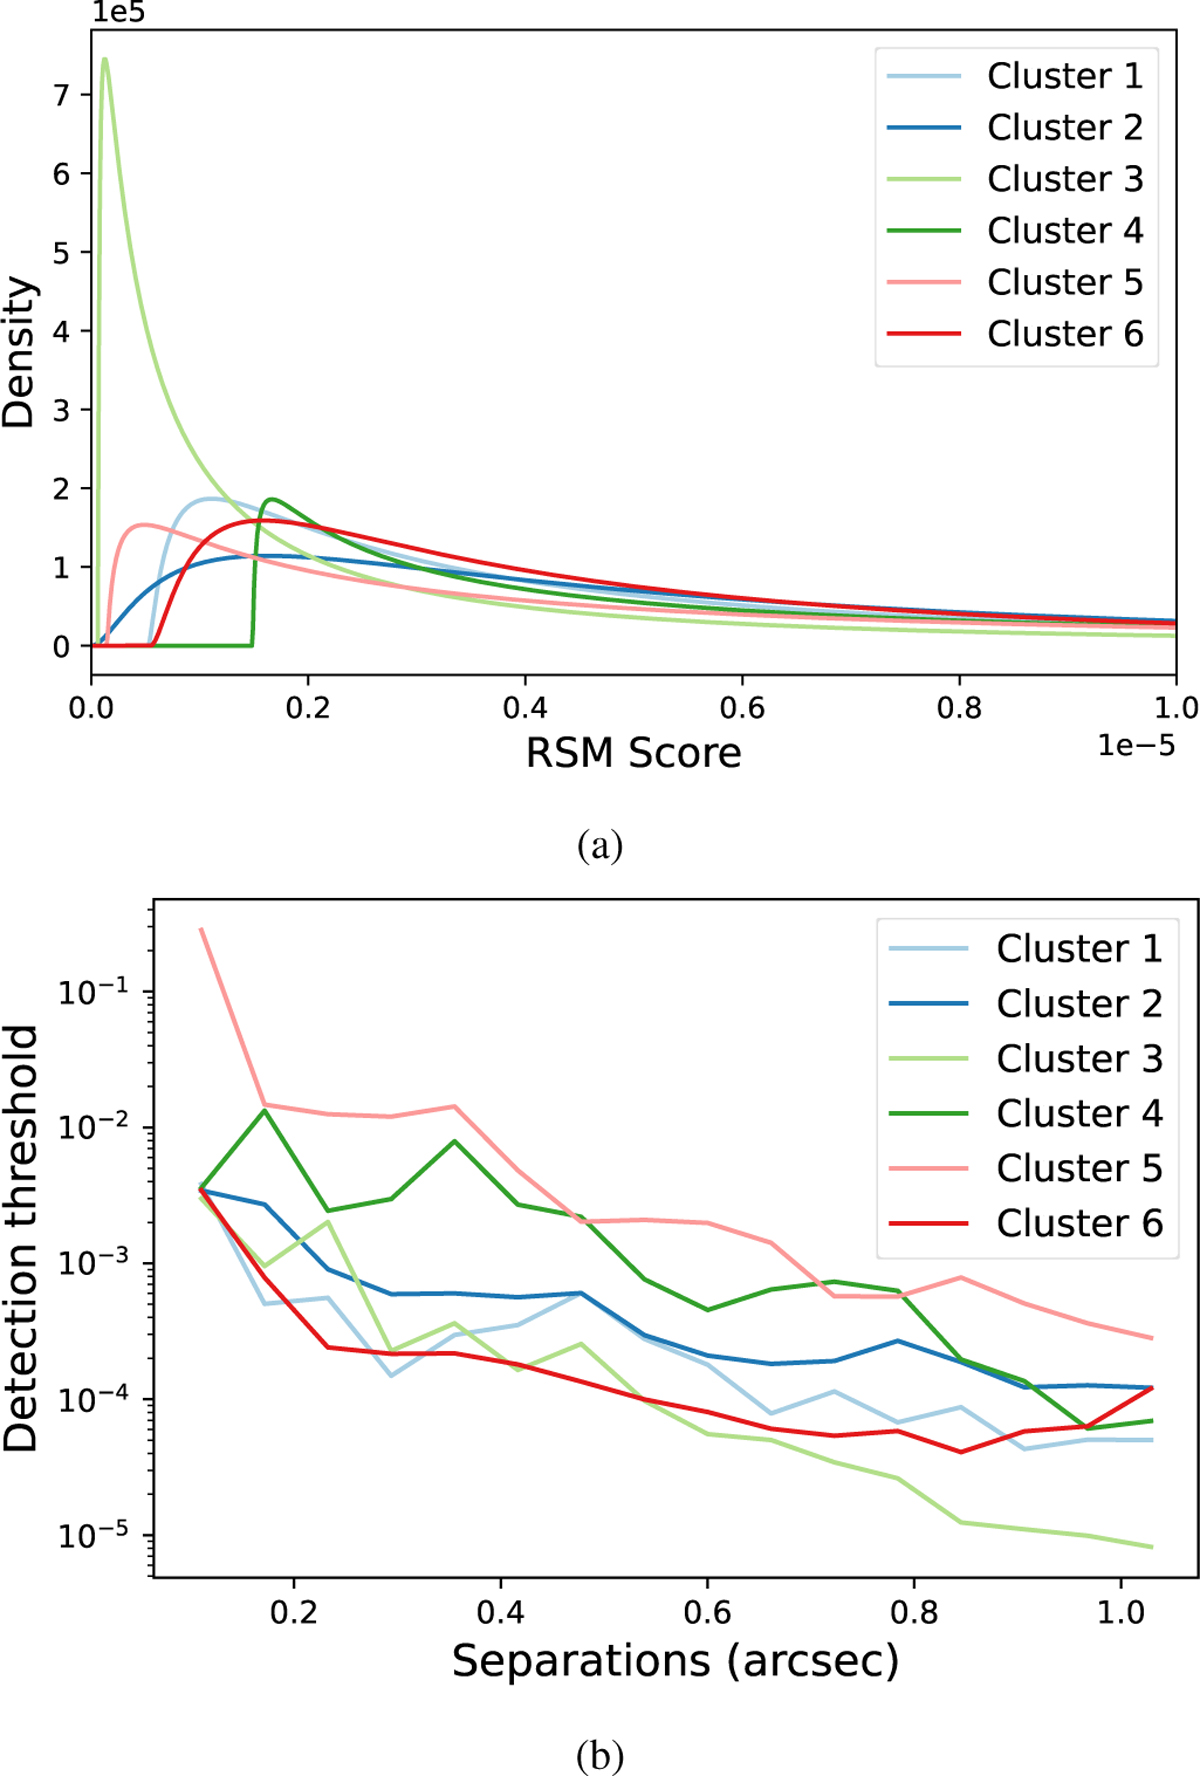
Top : lognormal distributions obtained by fitting RSM noise histograms at 0″.25 for various observing conditions (clusters) using RSM with APCA. Bottom : detection thresholds derived from the lognormal distributions at 3 × 10⁻⁷ FAP, as a function of angular separation and of observing conditions.
Current usage metrics show cumulative count of Article Views (full-text article views including HTML views, PDF and ePub downloads, according to the available data) and Abstracts Views on Vision4Press platform.
Data correspond to usage on the plateform after 2015. The current usage metrics is available 48-96 hours after online publication and is updated daily on week days.
Initial download of the metrics may take a while.