Open Access
Fig. 5
Download original image
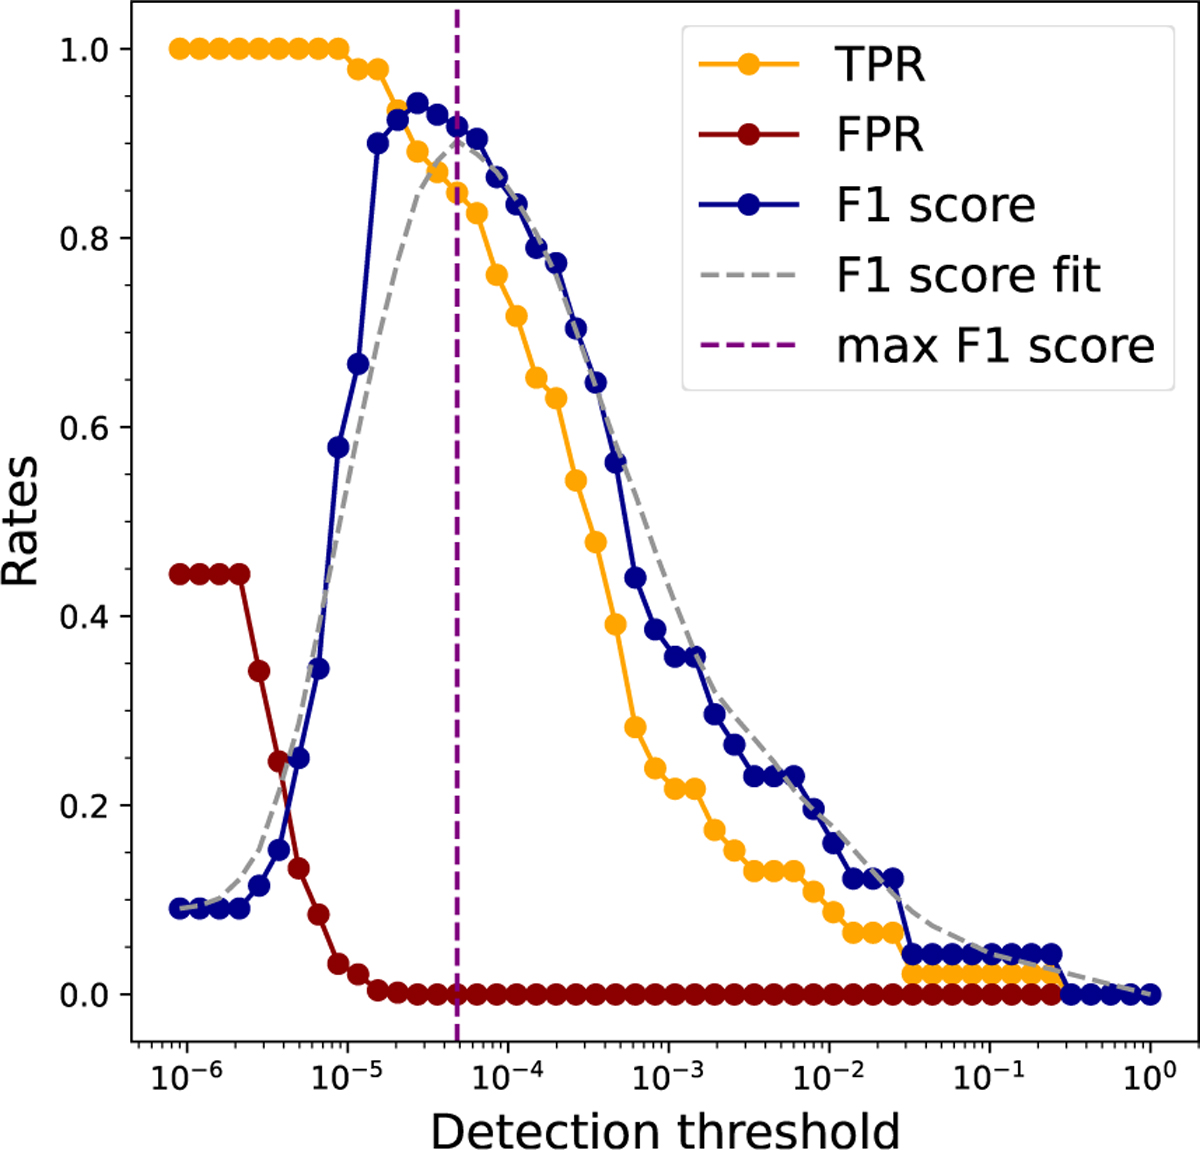
Variation of the TPR, FPR, and F1 score for the cluster 1 center at 0″.7. The dashed purple line marks the threshold that maximizes the fitted F1 score curve (dark blue curve), balancing high true positive (orange curve) recovery with minimal false positives (dark red curve).
Current usage metrics show cumulative count of Article Views (full-text article views including HTML views, PDF and ePub downloads, according to the available data) and Abstracts Views on Vision4Press platform.
Data correspond to usage on the plateform after 2015. The current usage metrics is available 48-96 hours after online publication and is updated daily on week days.
Initial download of the metrics may take a while.