Fig. 6
Download original image
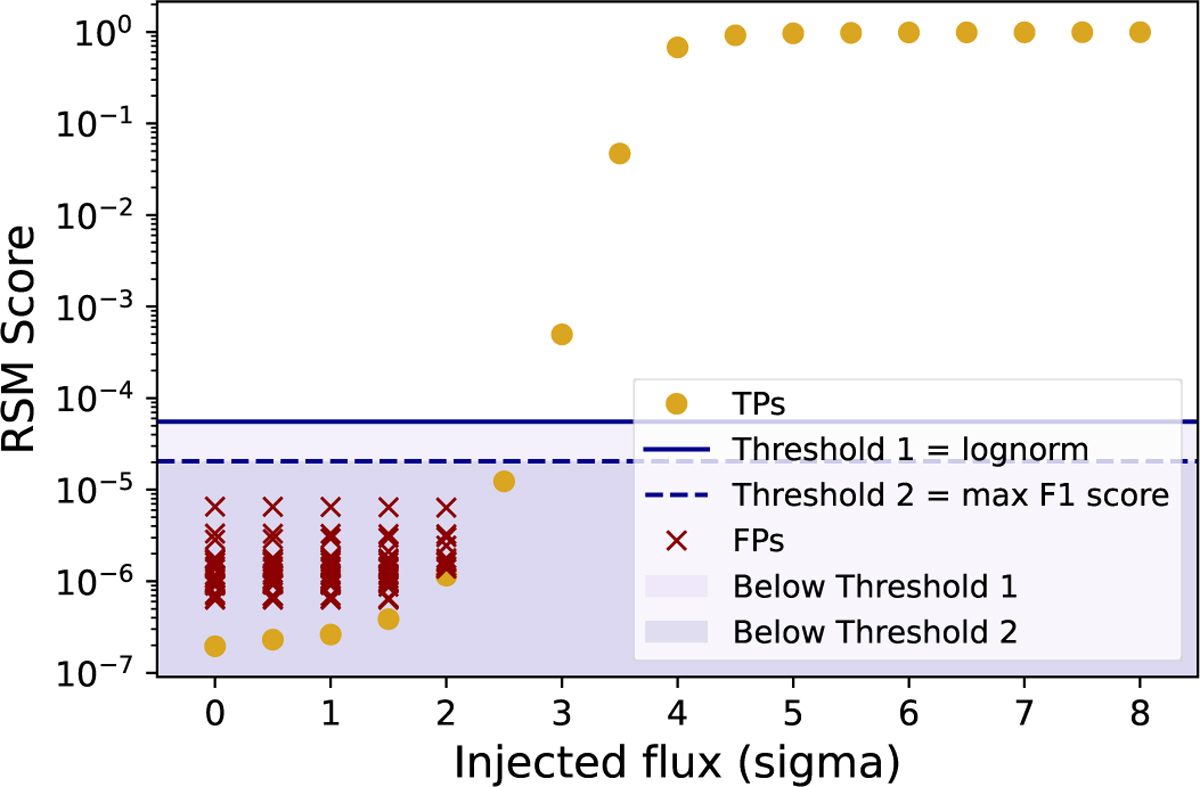
Comparison of detection thresholds with false positives and injected companions for the cluster 1 center at an angular separation of 0″.6 and showing the RSM scores of injected fake companions (gold dots), false positives (red crosses), the maximum F1 score threshold (dashed blue line), and the lognormal threshold (solid blue line).
Current usage metrics show cumulative count of Article Views (full-text article views including HTML views, PDF and ePub downloads, according to the available data) and Abstracts Views on Vision4Press platform.
Data correspond to usage on the plateform after 2015. The current usage metrics is available 48-96 hours after online publication and is updated daily on week days.
Initial download of the metrics may take a while.