Open Access
Fig. 7
Download original image
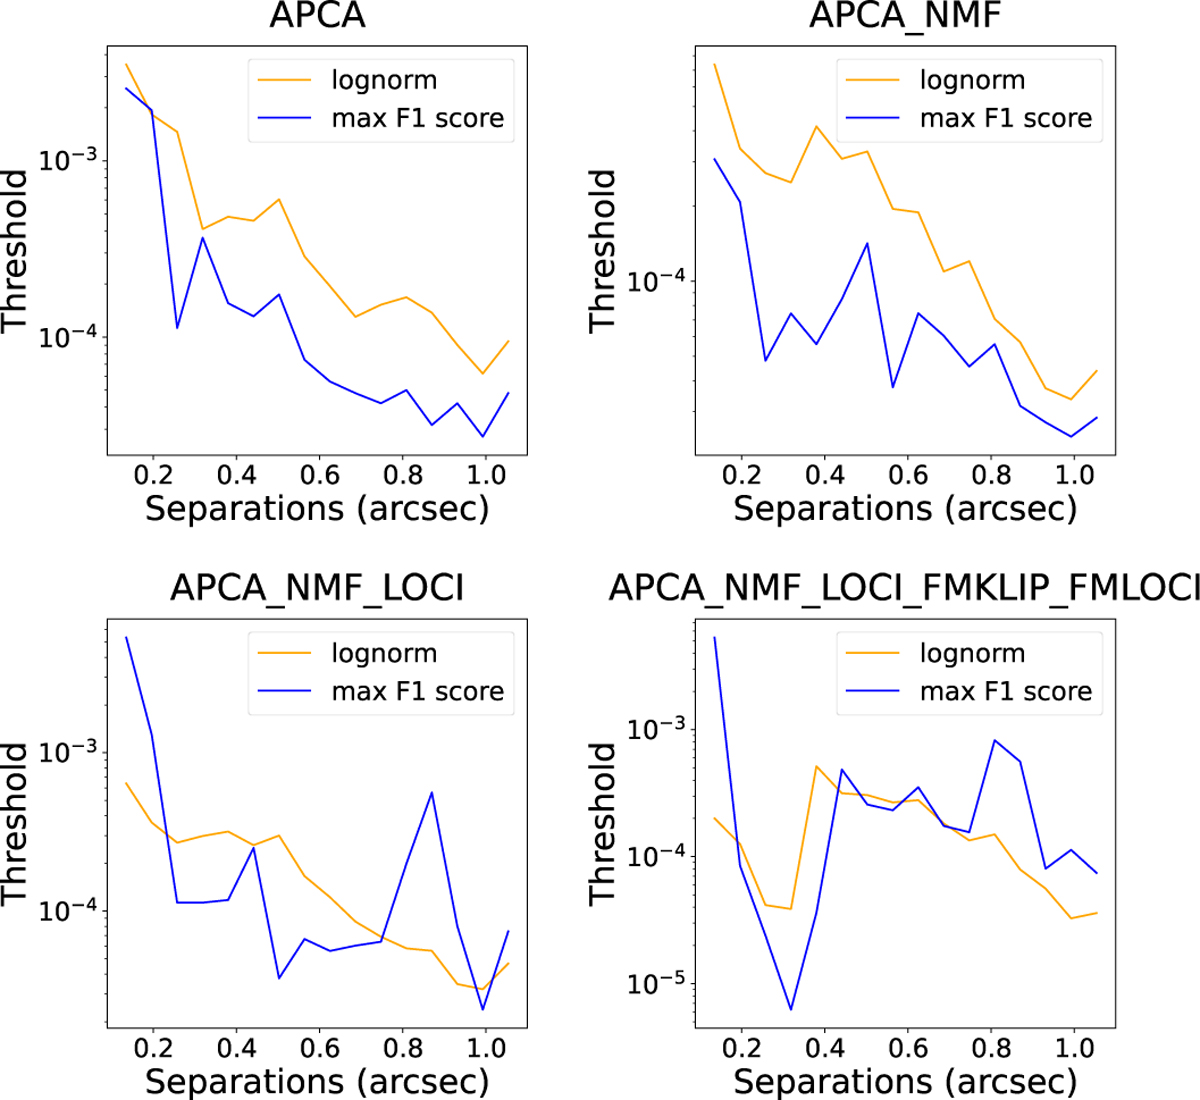
Median detection thresholds for the six different clusters using the 3 × 10⁻⁷ FAP under lognormal distribution (orange), compared with the threshold derived from the maximum F1 score on the cluster centers (blue), for different combinations of PSF subtraction techniques as described in the plot titles.
Current usage metrics show cumulative count of Article Views (full-text article views including HTML views, PDF and ePub downloads, according to the available data) and Abstracts Views on Vision4Press platform.
Data correspond to usage on the plateform after 2015. The current usage metrics is available 48-96 hours after online publication and is updated daily on week days.
Initial download of the metrics may take a while.