Fig. 9
Download original image
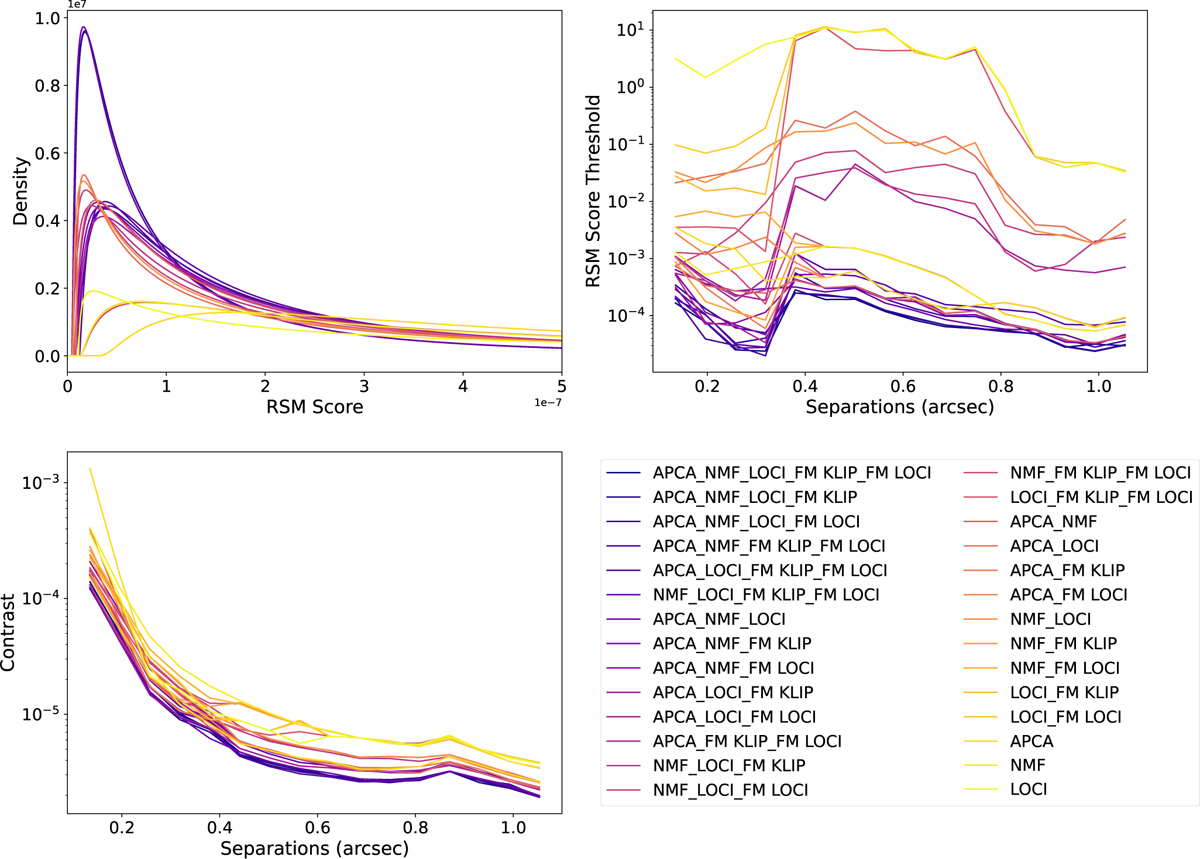
Effect of different combinations of PSF subtraction techniques in RSM on the fitted lognormal distributions, detection thresholds, and contrast curves. Top left : difference of lognormal fit across different PSF subtraction techniques with colors ranging from dark violet for multi combinations to yellow for singular combinations. Top right : distribution of the 3 × 10⁻⁷ FAP under lognormal distribution for the different combinations across all separations. Bottom left : contrast curve delivered by the different combinations with 50% completeness.
Current usage metrics show cumulative count of Article Views (full-text article views including HTML views, PDF and ePub downloads, according to the available data) and Abstracts Views on Vision4Press platform.
Data correspond to usage on the plateform after 2015. The current usage metrics is available 48-96 hours after online publication and is updated daily on week days.
Initial download of the metrics may take a while.