Fig. 3
Download original image
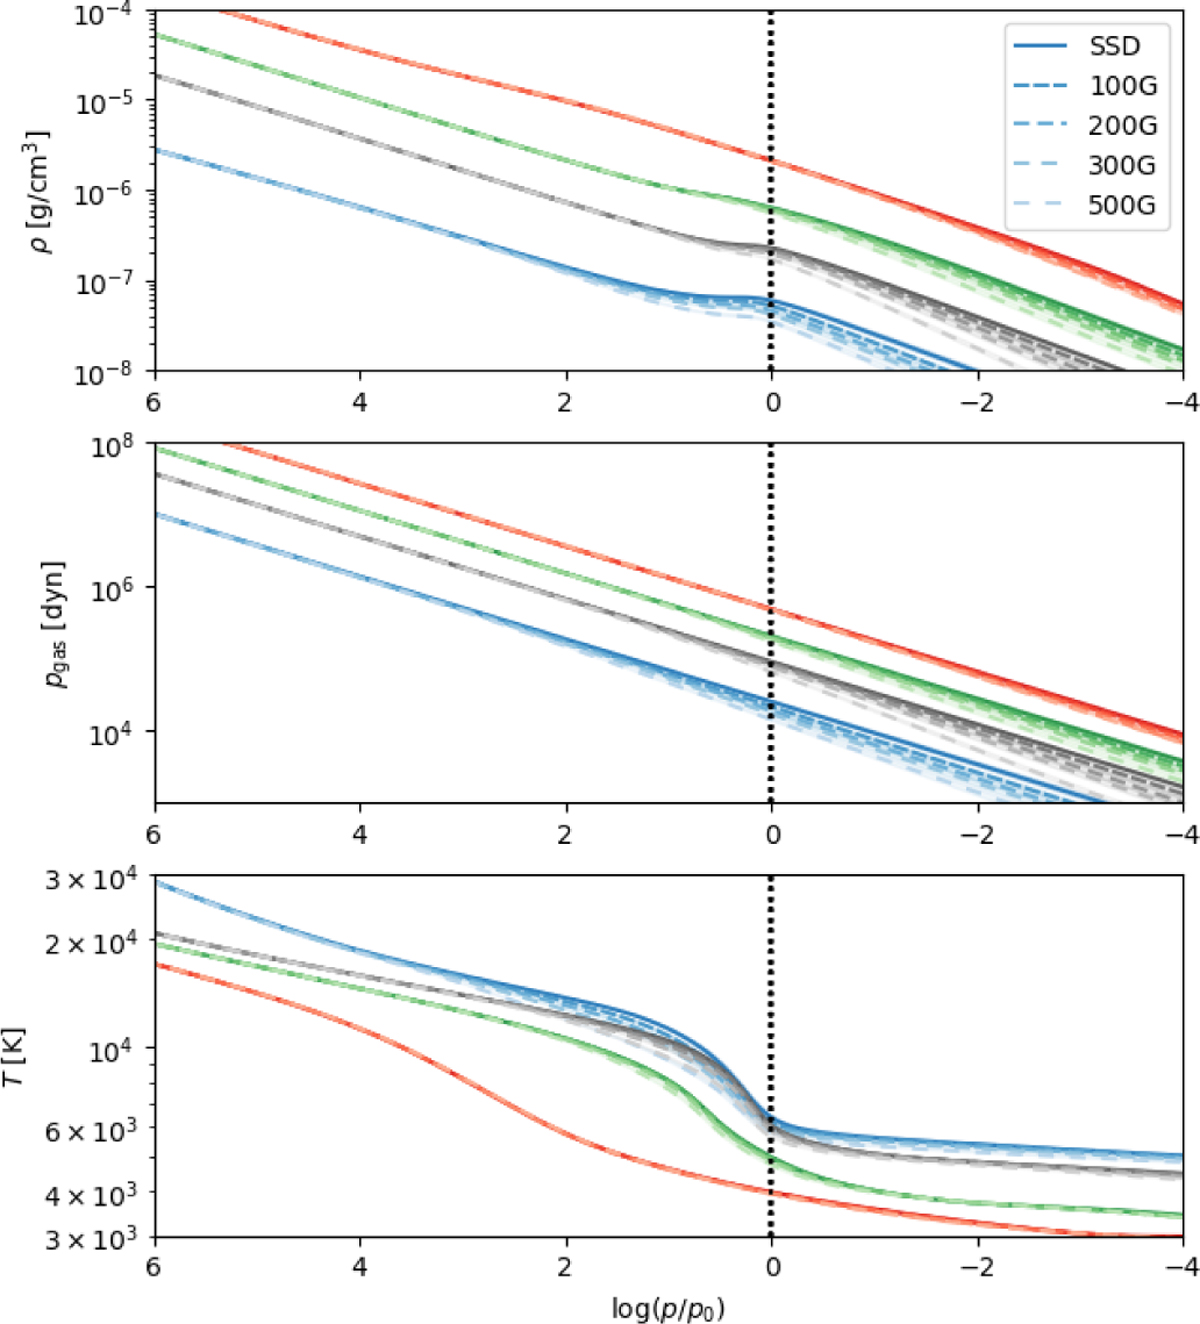
Density, ρ (top), gas pressure, pgas (middle), and temperature, T (bottom), for all magnetic field strengths and stellar types. The horizontal axis is the number of pressure scale heights below the surface computed for the SSD case for each star (the left side of the plot is toward the bottom boundary and the right side is toward the top). The vertical dotted line marks the height at which ⟨τ⟩ = 1 in each case.
Current usage metrics show cumulative count of Article Views (full-text article views including HTML views, PDF and ePub downloads, according to the available data) and Abstracts Views on Vision4Press platform.
Data correspond to usage on the plateform after 2015. The current usage metrics is available 48-96 hours after online publication and is updated daily on week days.
Initial download of the metrics may take a while.