Fig. 8
Download original image
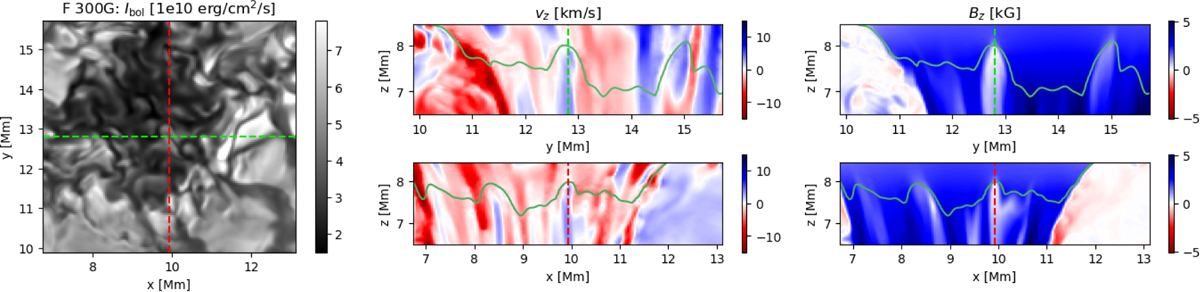
Zoom-in of the F-star pore-like structure in Fig. 1 showing umbral-dot-like features. Bolometric intensity of the zoomed-in region (left) with vertical cuts in convective velocity, vz (middle), and the vertical magnetic field, Bz (right), along the y and x axes. The dashed colored lines represent the locations of the cuts and the solid green line represents the τ = 1 surface. The bottom of the simulation box corresponds to z = 0 for reference.
Current usage metrics show cumulative count of Article Views (full-text article views including HTML views, PDF and ePub downloads, according to the available data) and Abstracts Views on Vision4Press platform.
Data correspond to usage on the plateform after 2015. The current usage metrics is available 48-96 hours after online publication and is updated daily on week days.
Initial download of the metrics may take a while.