Fig. 2
Download original image
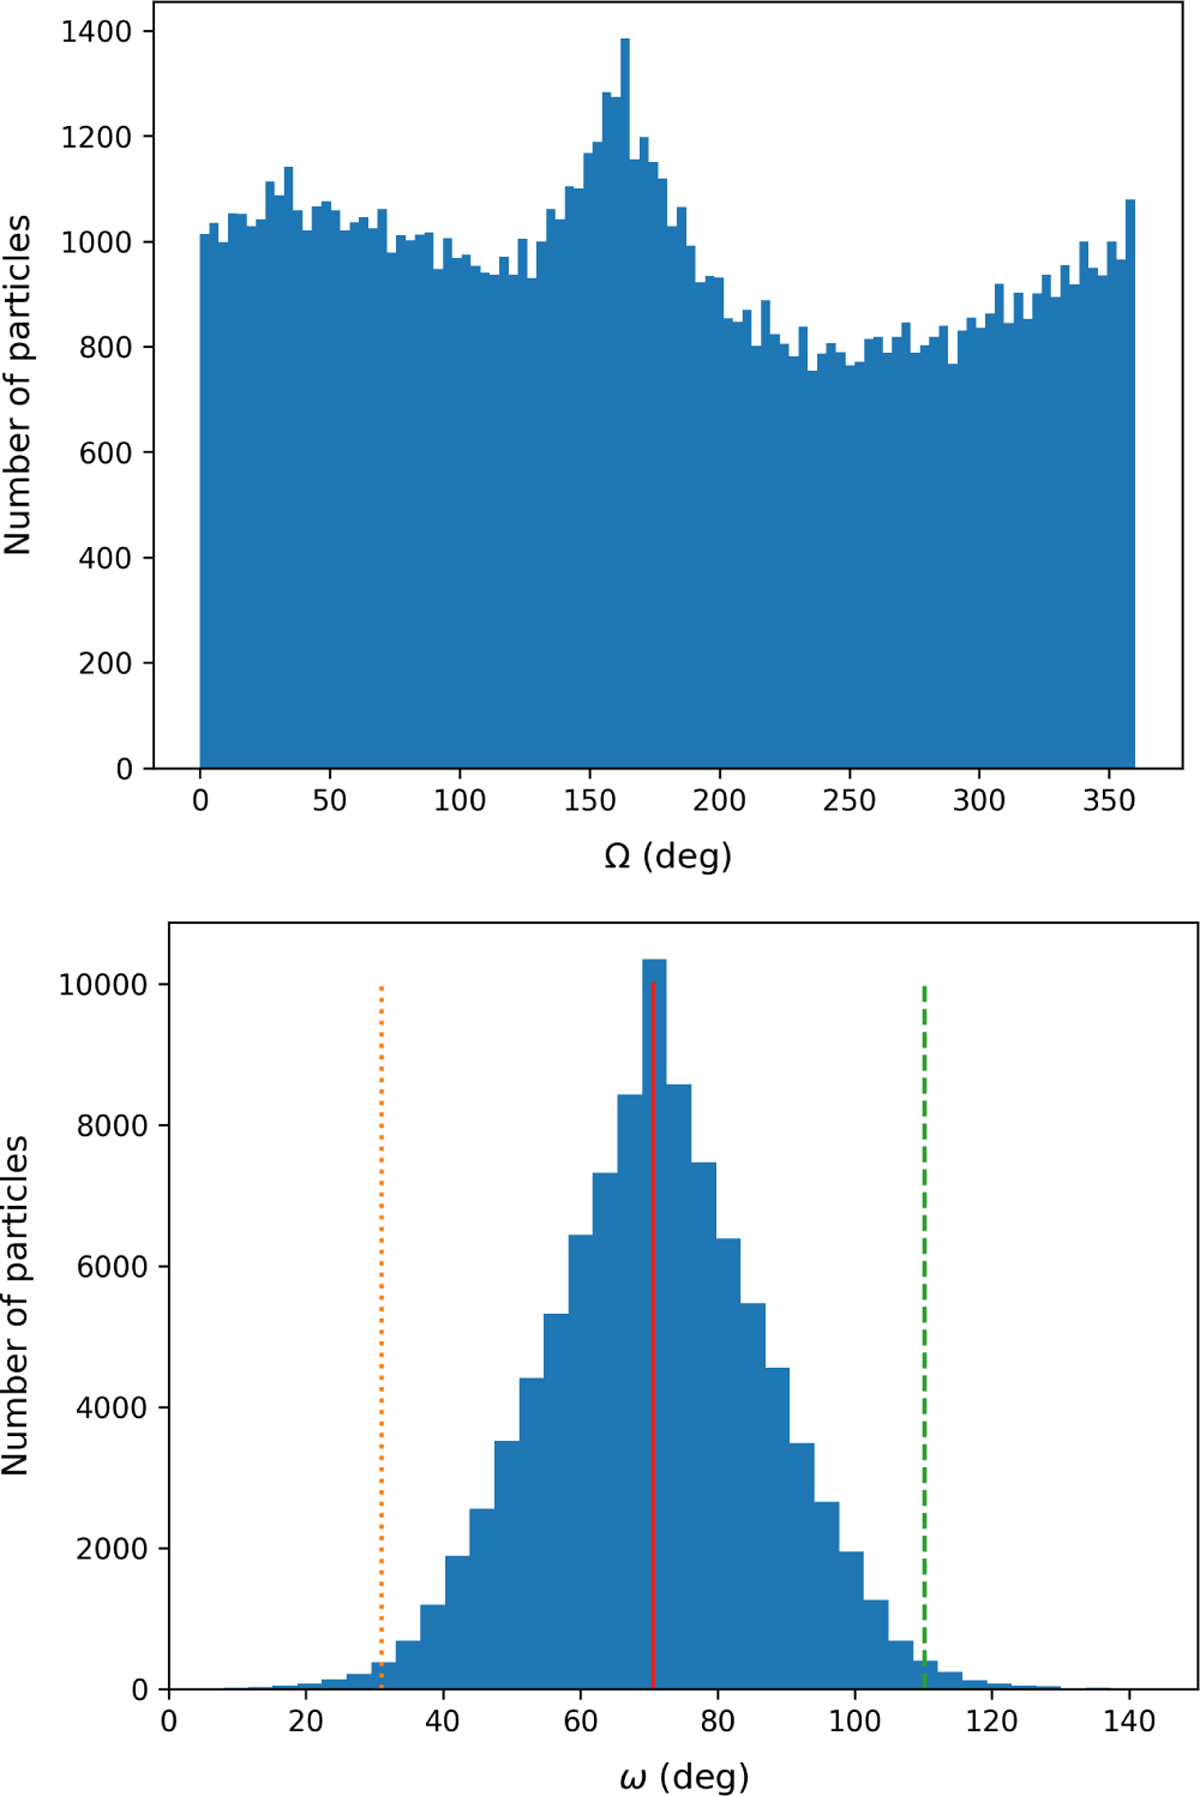
Histograms of the distribution of the longitude of ascending node (Ω) and of the distribution of the argument of perihelion (ω) after the end of the integration (2000 years) of IC1. For the distribution of the argument of perihelion, the continuous red line in the middle is the value of the mean, the dotted orange line on the left corresponds to the value of the mean minus three standard deviation, and the dashed green line on the right shows the value of the mean plus three standard deviation.
Current usage metrics show cumulative count of Article Views (full-text article views including HTML views, PDF and ePub downloads, according to the available data) and Abstracts Views on Vision4Press platform.
Data correspond to usage on the plateform after 2015. The current usage metrics is available 48-96 hours after online publication and is updated daily on week days.
Initial download of the metrics may take a while.