Fig. 7
Download original image
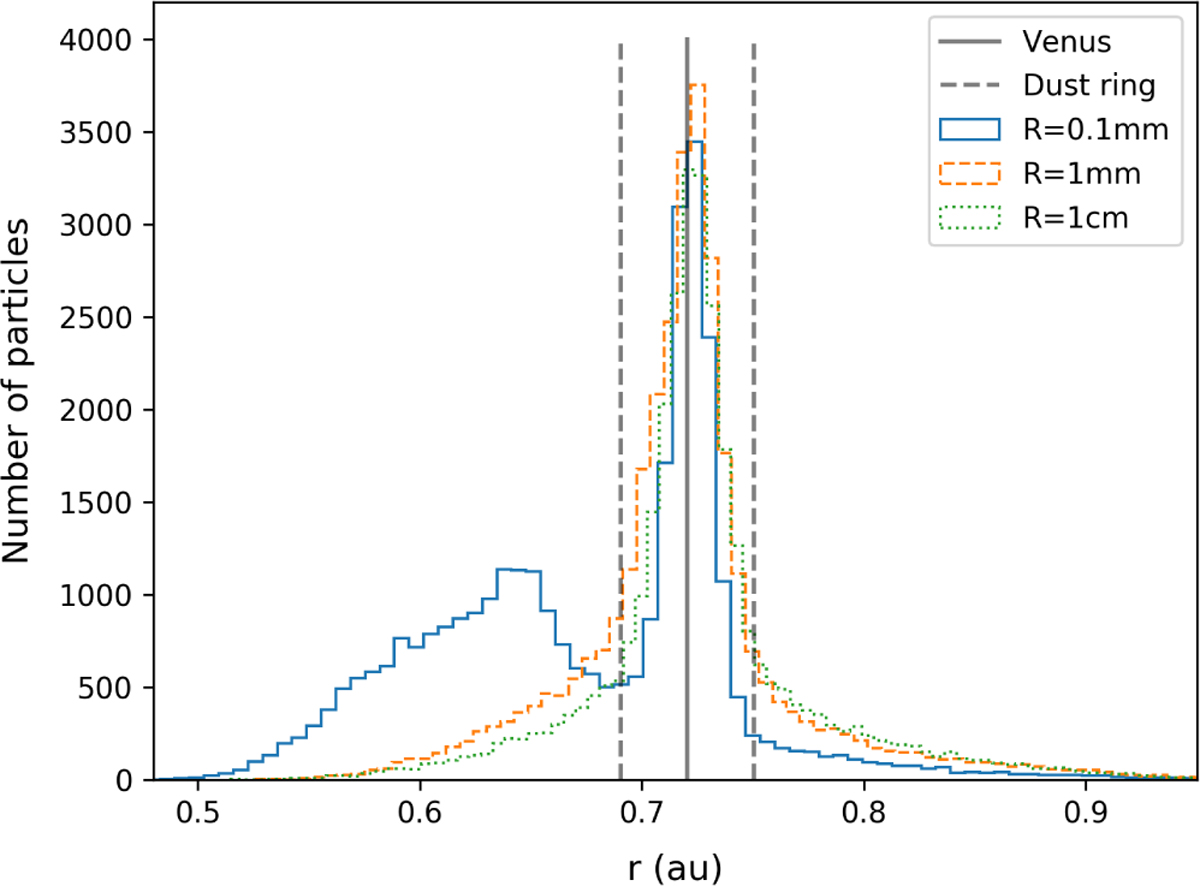
Histogram of the distribution of the particles on the r values after 6000 years of integration, slightly zoomed-in. The black line represents Venus’s orbit. The dashed grey lines show the limit of the dust ring. Each curve corresponds to a different particle size (dotted green line for 1 cm radius, dashed orange line for 1 mm, and solid blue line for 0.1 mm).
Current usage metrics show cumulative count of Article Views (full-text article views including HTML views, PDF and ePub downloads, according to the available data) and Abstracts Views on Vision4Press platform.
Data correspond to usage on the plateform after 2015. The current usage metrics is available 48-96 hours after online publication and is updated daily on week days.
Initial download of the metrics may take a while.