Fig. 8
Download original image
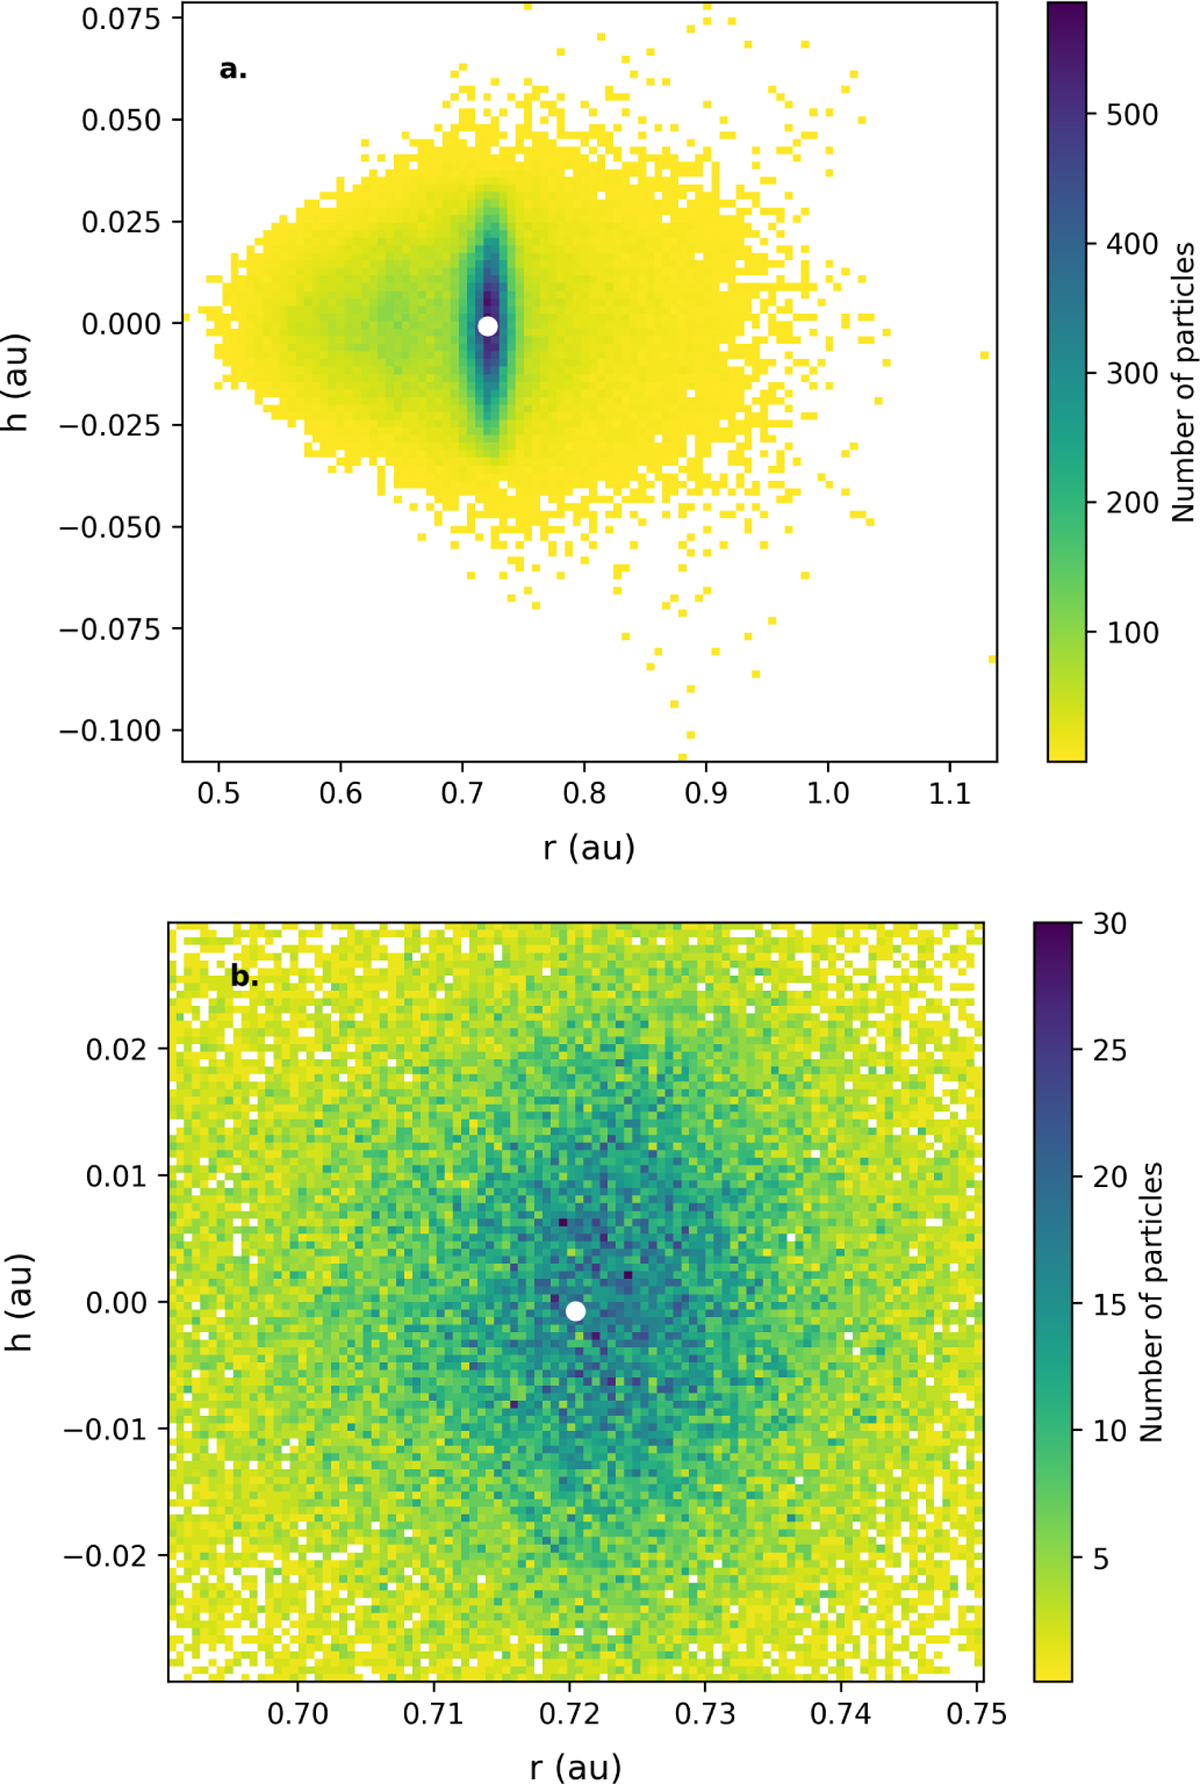
Two-dimensional histogram of particles after 6000 years of integration representing the cross-section of the ring. The white dot in the centre represents Venus’s position at the end of the integration. Panel a: Representation of the whole section. Panel b: Similar 2D histogram, but zoomed-in on the centre of the ring, with r and h scaled similarly.
Current usage metrics show cumulative count of Article Views (full-text article views including HTML views, PDF and ePub downloads, according to the available data) and Abstracts Views on Vision4Press platform.
Data correspond to usage on the plateform after 2015. The current usage metrics is available 48-96 hours after online publication and is updated daily on week days.
Initial download of the metrics may take a while.