Open Access
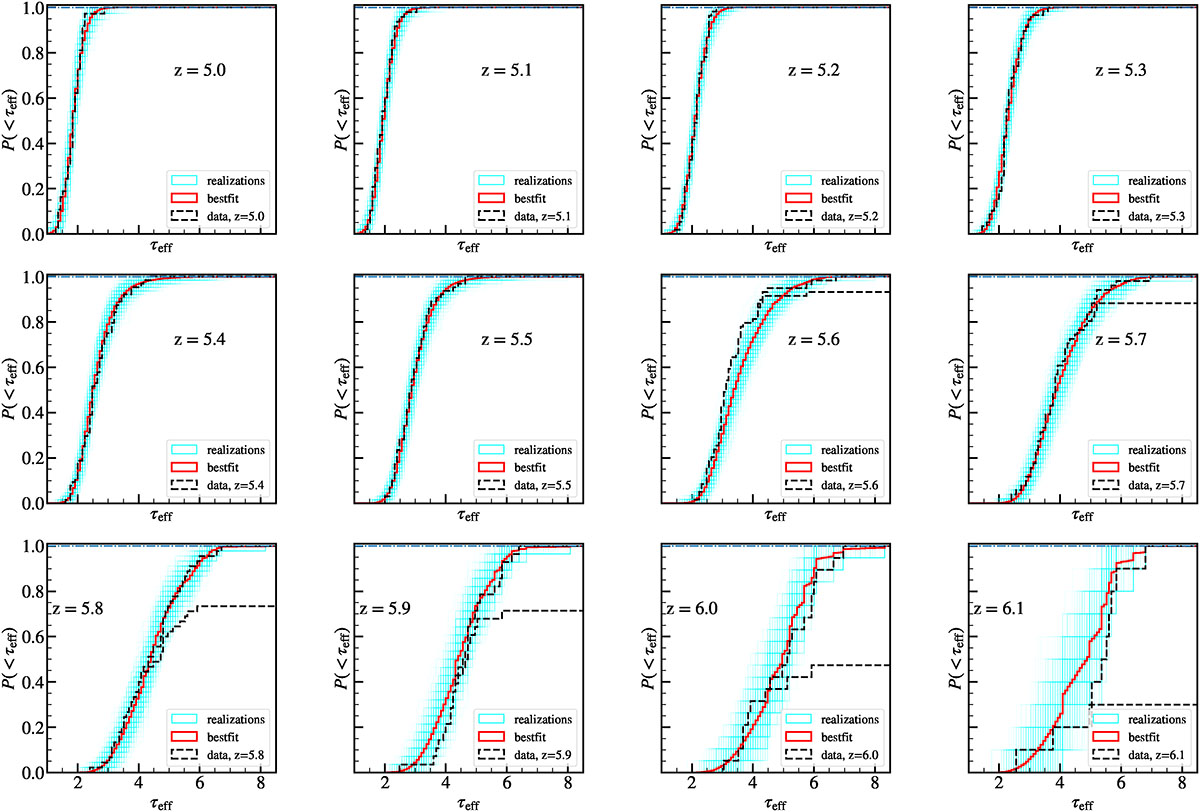
Fig. 10.
Download original image
CDF plots of τeff for different redshifts (z = 5.0 − 6.1). Each panel shows the combined CDFs of the bestfit model using 500 random realizations (red) along with the individual realization (cyan) and observational data (black). We show both the optimistic and pessimistic scenarios for the data.
Current usage metrics show cumulative count of Article Views (full-text article views including HTML views, PDF and ePub downloads, according to the available data) and Abstracts Views on Vision4Press platform.
Data correspond to usage on the plateform after 2015. The current usage metrics is available 48-96 hours after online publication and is updated daily on week days.
Initial download of the metrics may take a while.