Open Access
Fig. 3.
Download original image
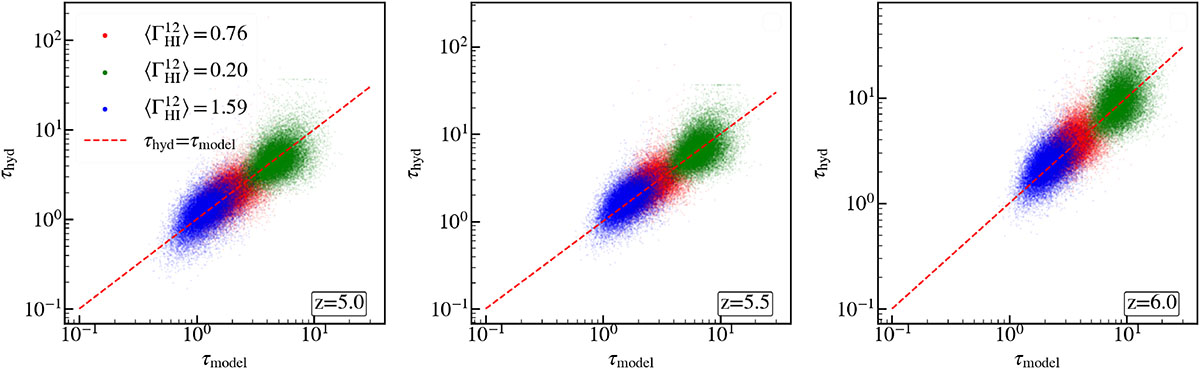
Comparison of optical depths from hydro simulation (τhyd) and calibrated empirical model (τmodel) for three different redshifts (z = 5.0, 5.5 & 6.0) used for calibration. The different colors indicate the set of different values of mean photoionization rates.
Current usage metrics show cumulative count of Article Views (full-text article views including HTML views, PDF and ePub downloads, according to the available data) and Abstracts Views on Vision4Press platform.
Data correspond to usage on the plateform after 2015. The current usage metrics is available 48-96 hours after online publication and is updated daily on week days.
Initial download of the metrics may take a while.