Fig. 4.
Download original image
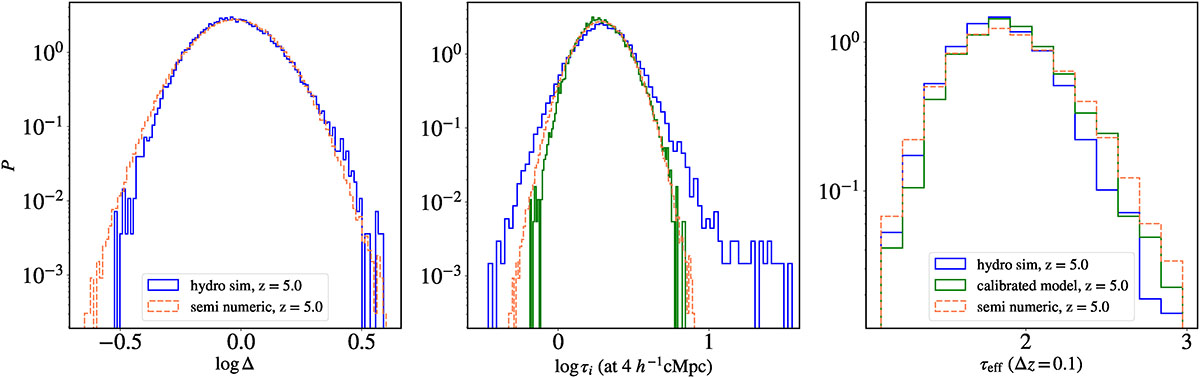
Left Panel: Distribution of densities (logΔ) from the hydro simulation (blue) and the semi-numerical setup (dashed orange). Middle Panel: Distribution of optical depths averaged at 4 h−1cMpc scale (τi) for hydro simulation (blue), calibrated empirical relation (green), and calibrated semi-numerical setup (dashed orange). Right Panel: Distributions of effective optical depth skewers (τeff) for the previous three cases.
Current usage metrics show cumulative count of Article Views (full-text article views including HTML views, PDF and ePub downloads, according to the available data) and Abstracts Views on Vision4Press platform.
Data correspond to usage on the plateform after 2015. The current usage metrics is available 48-96 hours after online publication and is updated daily on week days.
Initial download of the metrics may take a while.