Fig. 9.
Download original image
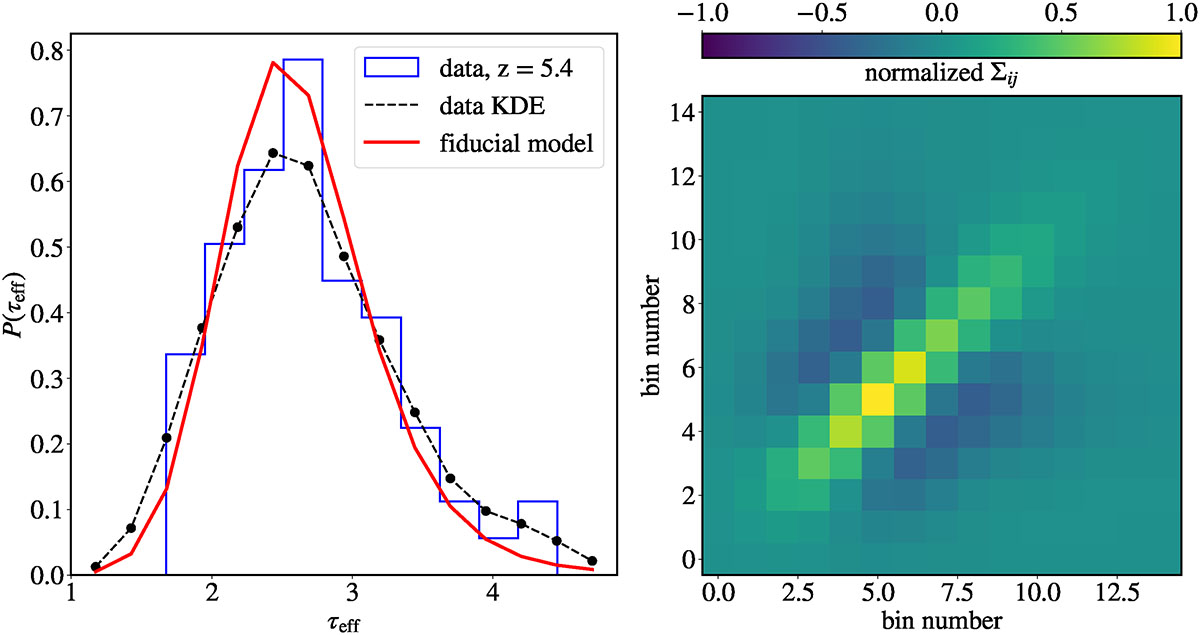
Left Panel: Example of probability distribution functions (PDFs) from the data and the fiducial model at redshift z = 5.4. The blue line shows the histogram obtained from the data, while the dashed black line shows the fit using Gaussian KDE. Similarly, the red line shows the distribution obtained from our fiducial model. For the likelihood analysis, we use 15 equally spaced bins as marked by the black solid points. Right Panel: Normalized covariance matrix at z = 5.4.
Current usage metrics show cumulative count of Article Views (full-text article views including HTML views, PDF and ePub downloads, according to the available data) and Abstracts Views on Vision4Press platform.
Data correspond to usage on the plateform after 2015. The current usage metrics is available 48-96 hours after online publication and is updated daily on week days.
Initial download of the metrics may take a while.