Fig. 1
Download original image
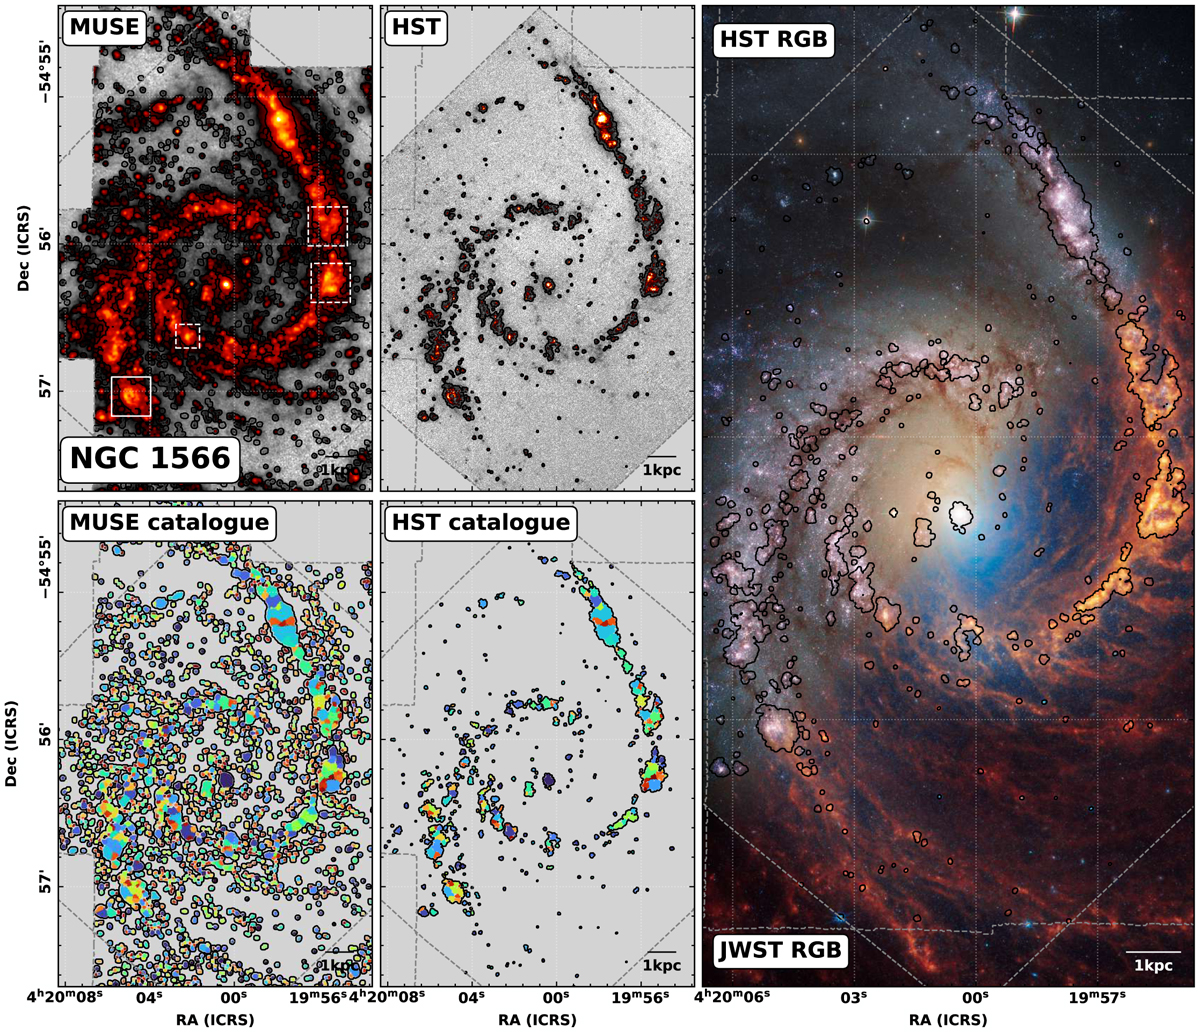
Overview of the nebula catalogues towards NGC 1566. (Upper left) The background colour scale shows the Hα emission from the PHANGS-MUSE observations (Emsellem et al. 2022), overlaid with contours showing the boundaries of the sources identified in the PHANGS-MUSE Nebula Catalogue (Groves et al. 2023, see also Santoro et al. 2022). White boxes indicate the positions of the regions shown in Figs. 2 (solid lines) and C. 1 (dashed lines). (Upper centre) The background colour scale shows the Hα emission from the PHANGS-HST Hα observations (Chandar et al. 2025), overlaid with contours showing the boundaries of the sources identified in this work in the PHANGS-HST Nebula Catalogue. (Bottom left) The PHANGS-MUSE Nebula Catalogue masks and (bottom centre) PHANGS-HST Nebula Catalogue masks are shown with the same colour scale, where the colours denote the region ID. (Right) Composite of separate exposures acquired with JWST using the NIRCam and MIRI instruments (Lee et al. 2023; Williams et al. 2024), and the HST using the ACS/WFC instrument (Lee et al. 2022). For the JWST part of the image, the assigned colours are Red = F2100W + F1130W + F1000W + F770W, Green = F770W + F360M, Blue = F335M + F300M. For the HST part of the image, the assigned colours are Red = F814W + F656N, Green = F555W, Blue = F435W. Overlaid as contours is the PHANGS-HST Nebula Catalogue (as in the other panels).
Current usage metrics show cumulative count of Article Views (full-text article views including HTML views, PDF and ePub downloads, according to the available data) and Abstracts Views on Vision4Press platform.
Data correspond to usage on the plateform after 2015. The current usage metrics is available 48-96 hours after online publication and is updated daily on week days.
Initial download of the metrics may take a while.