Fig. 10
Download original image
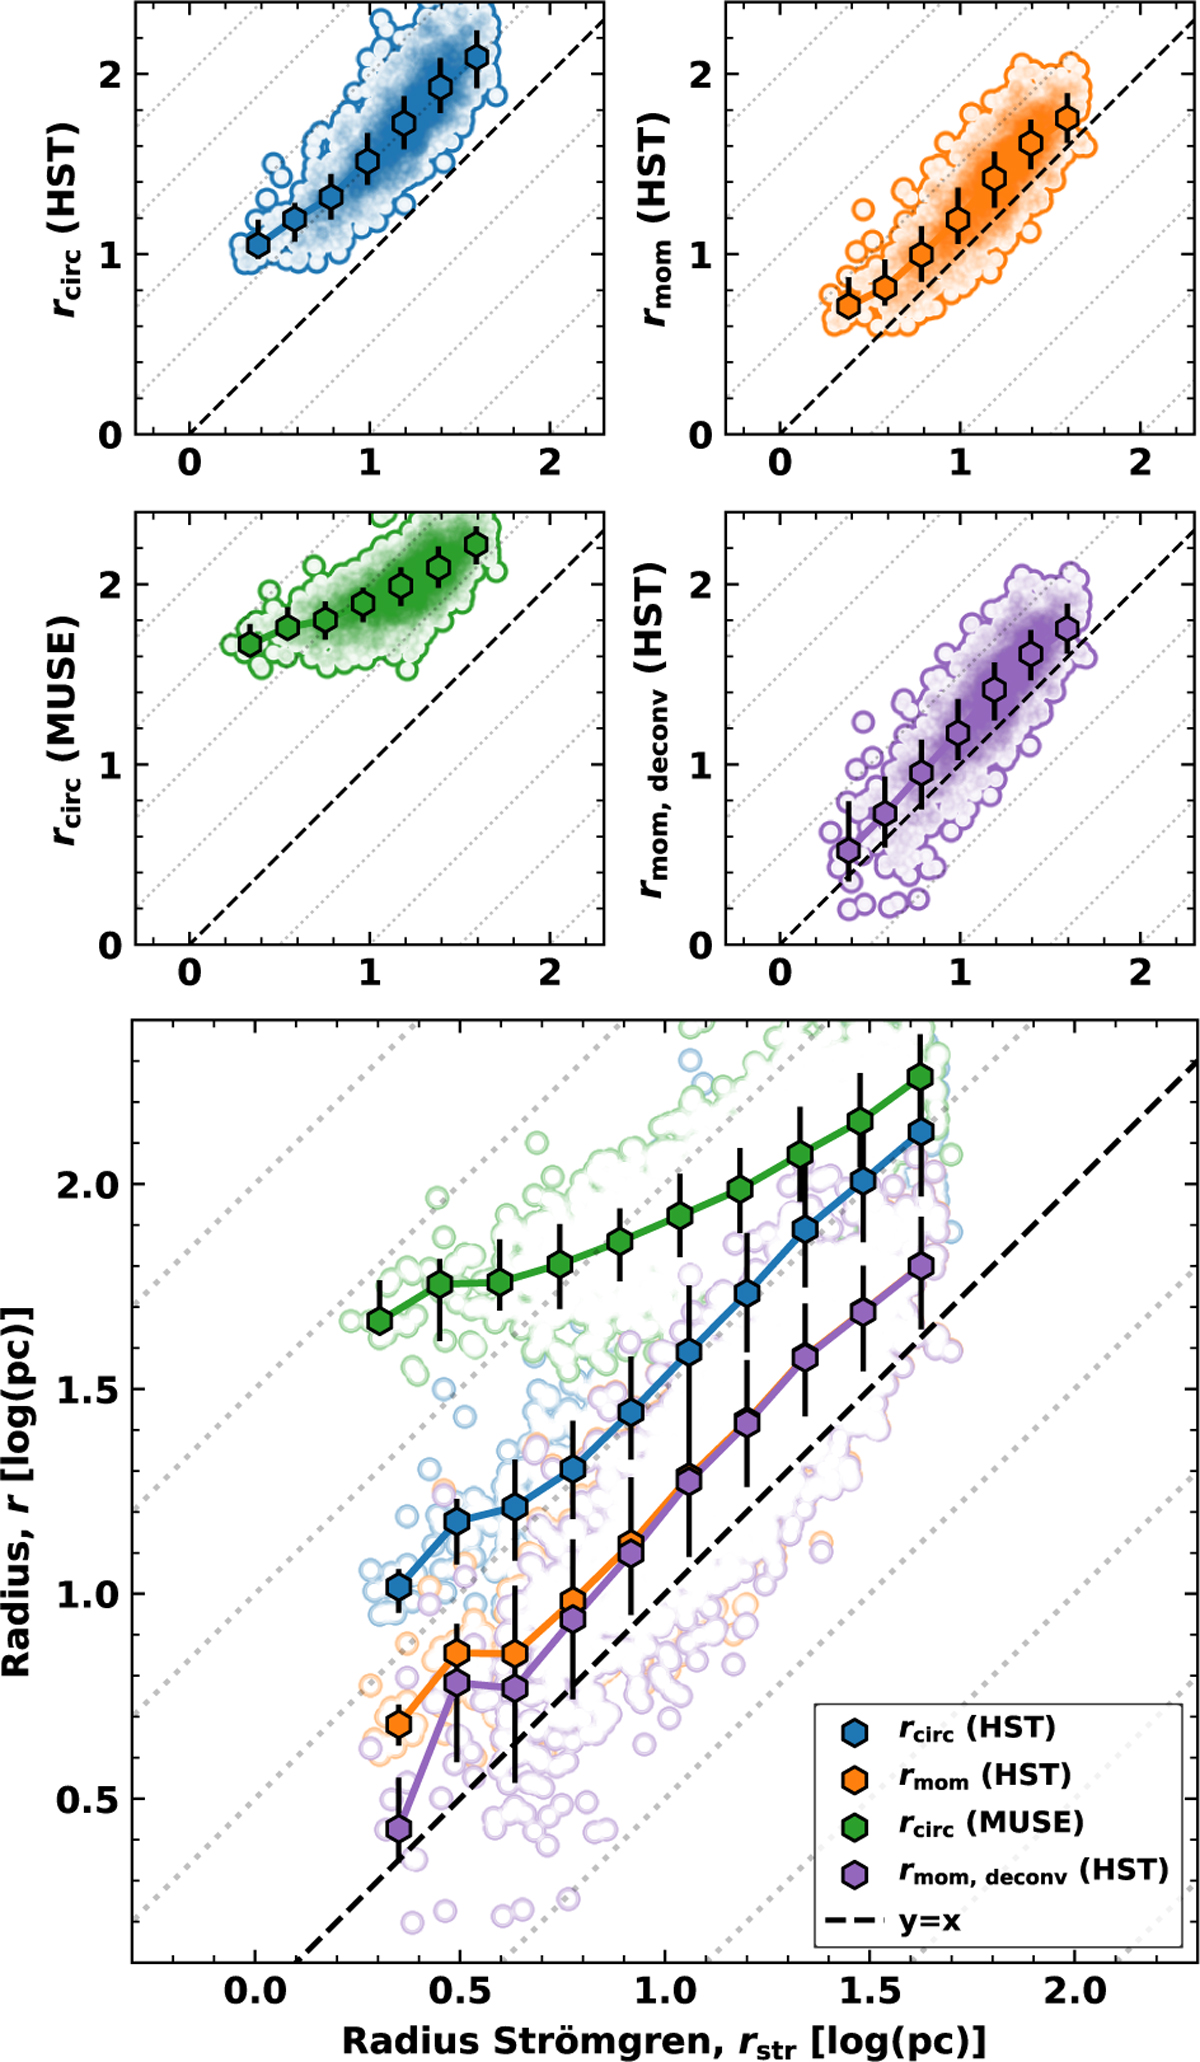
Comparison of observed nebula sizes with theoretical Strömgren radii (Sect. 5.2). The top four panels (2 × 2) show, individually, r versus the Strömgren radius rstr for rcirc (HST), rmom (HST), rcirc (MUSE), and rmom,deconv (HST), respectively. The bottom panel overlays all four measurements. In every panel, points are binned at equal intervals in rstr; symbols mark bin medians and error bars indicate the standard deviation of values within each bin. The y = x relation is shown as a dashed black line (with faint dotted offset guides in the overlay).
Current usage metrics show cumulative count of Article Views (full-text article views including HTML views, PDF and ePub downloads, according to the available data) and Abstracts Views on Vision4Press platform.
Data correspond to usage on the plateform after 2015. The current usage metrics is available 48-96 hours after online publication and is updated daily on week days.
Initial download of the metrics may take a while.