Fig. 13
Download original image
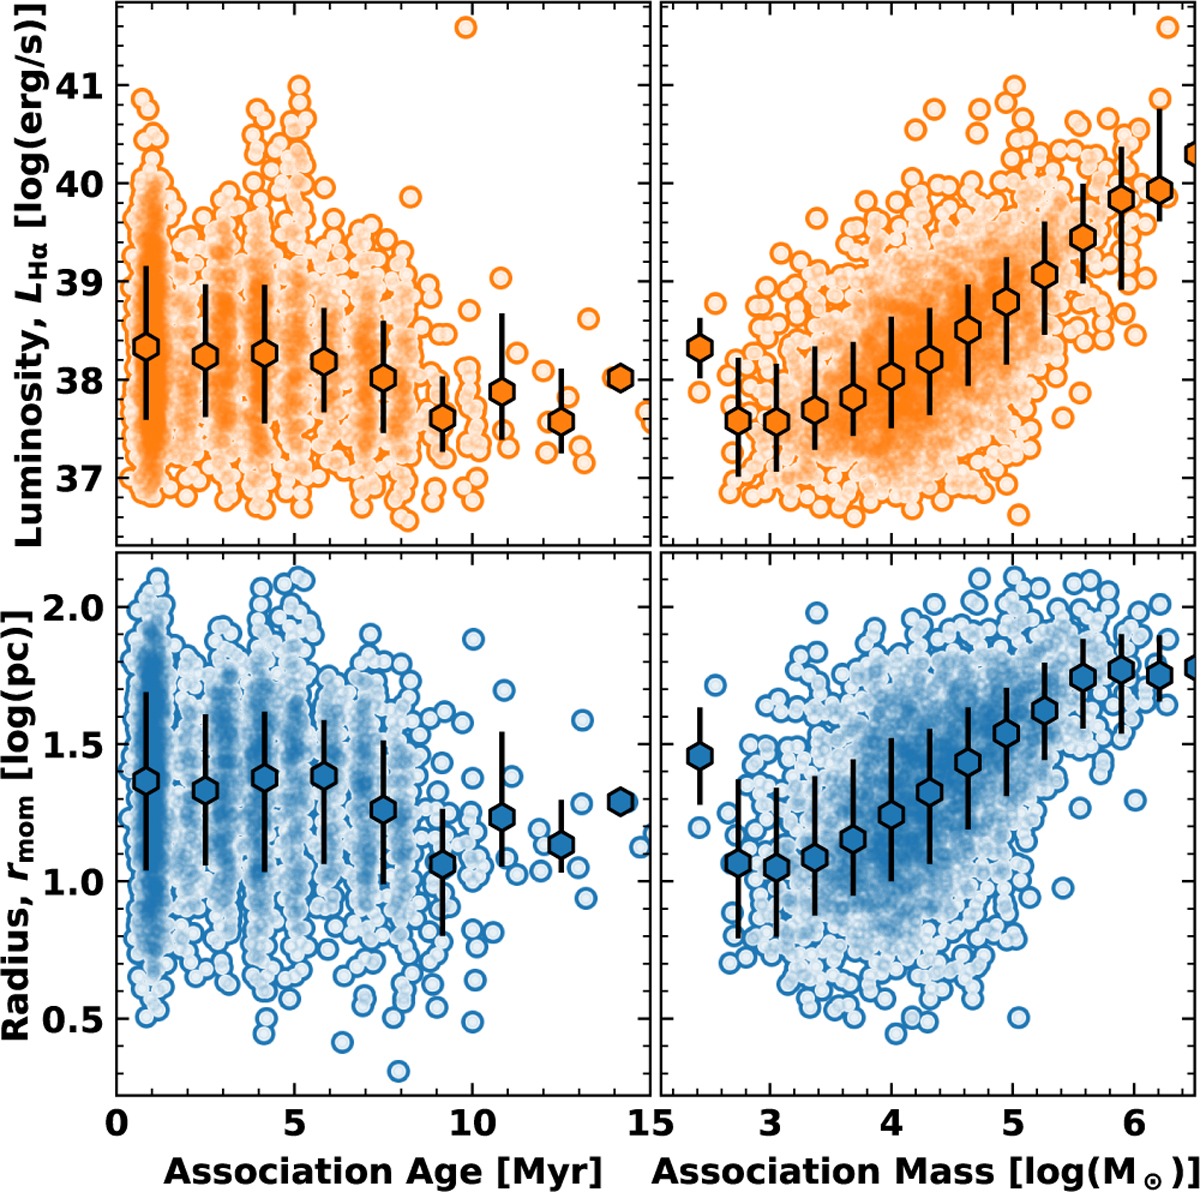
Size and luminosity of the H II regions as a function of the stellar association age (left panels) and mass (right panels). The top row shows the attenuation-corrected Hα luminosity, while the bottom row shows the circularised radius. We show only the NUV-selected multiscale stellar associations at a scale of 32 pc, which is comparable to Scheuermann et al. (2023). Overlaid are equally spaced binned points (median values per bin), with error bars indicating the 16th to 84th percentile range of the data within each bin.
Current usage metrics show cumulative count of Article Views (full-text article views including HTML views, PDF and ePub downloads, according to the available data) and Abstracts Views on Vision4Press platform.
Data correspond to usage on the plateform after 2015. The current usage metrics is available 48-96 hours after online publication and is updated daily on week days.
Initial download of the metrics may take a while.