Fig. C.1
Download original image
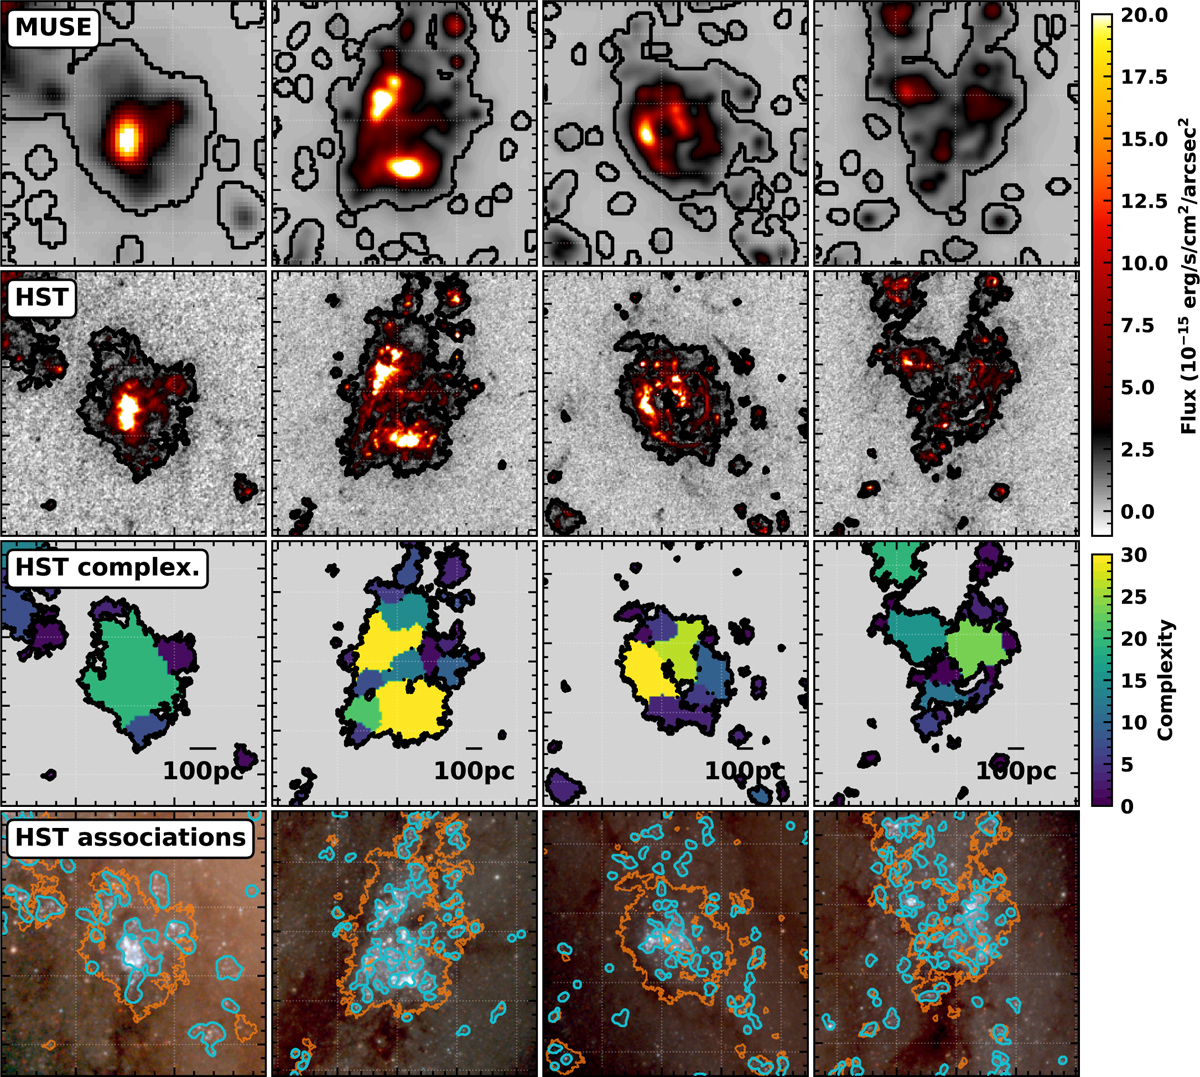
Example of several regions within the nebula catalogues towards NGC 1566. The MUSE (first row) and HST (second row) observations, overlaid with contours showing the boundary of each source in the respective observations. (third row) We show a map of the complexity score for each region. (fourth row) We show the nebula (red contours) and 32 pc NUV-identified stellar association (Larson et al. 2023; blue contour) overlaid on a HST filter red (F814W) green (F555W) blue (F438W+F336W) image (see Lee et al. 2022).
Current usage metrics show cumulative count of Article Views (full-text article views including HTML views, PDF and ePub downloads, according to the available data) and Abstracts Views on Vision4Press platform.
Data correspond to usage on the plateform after 2015. The current usage metrics is available 48-96 hours after online publication and is updated daily on week days.
Initial download of the metrics may take a while.