Fig. D.1
Download original image
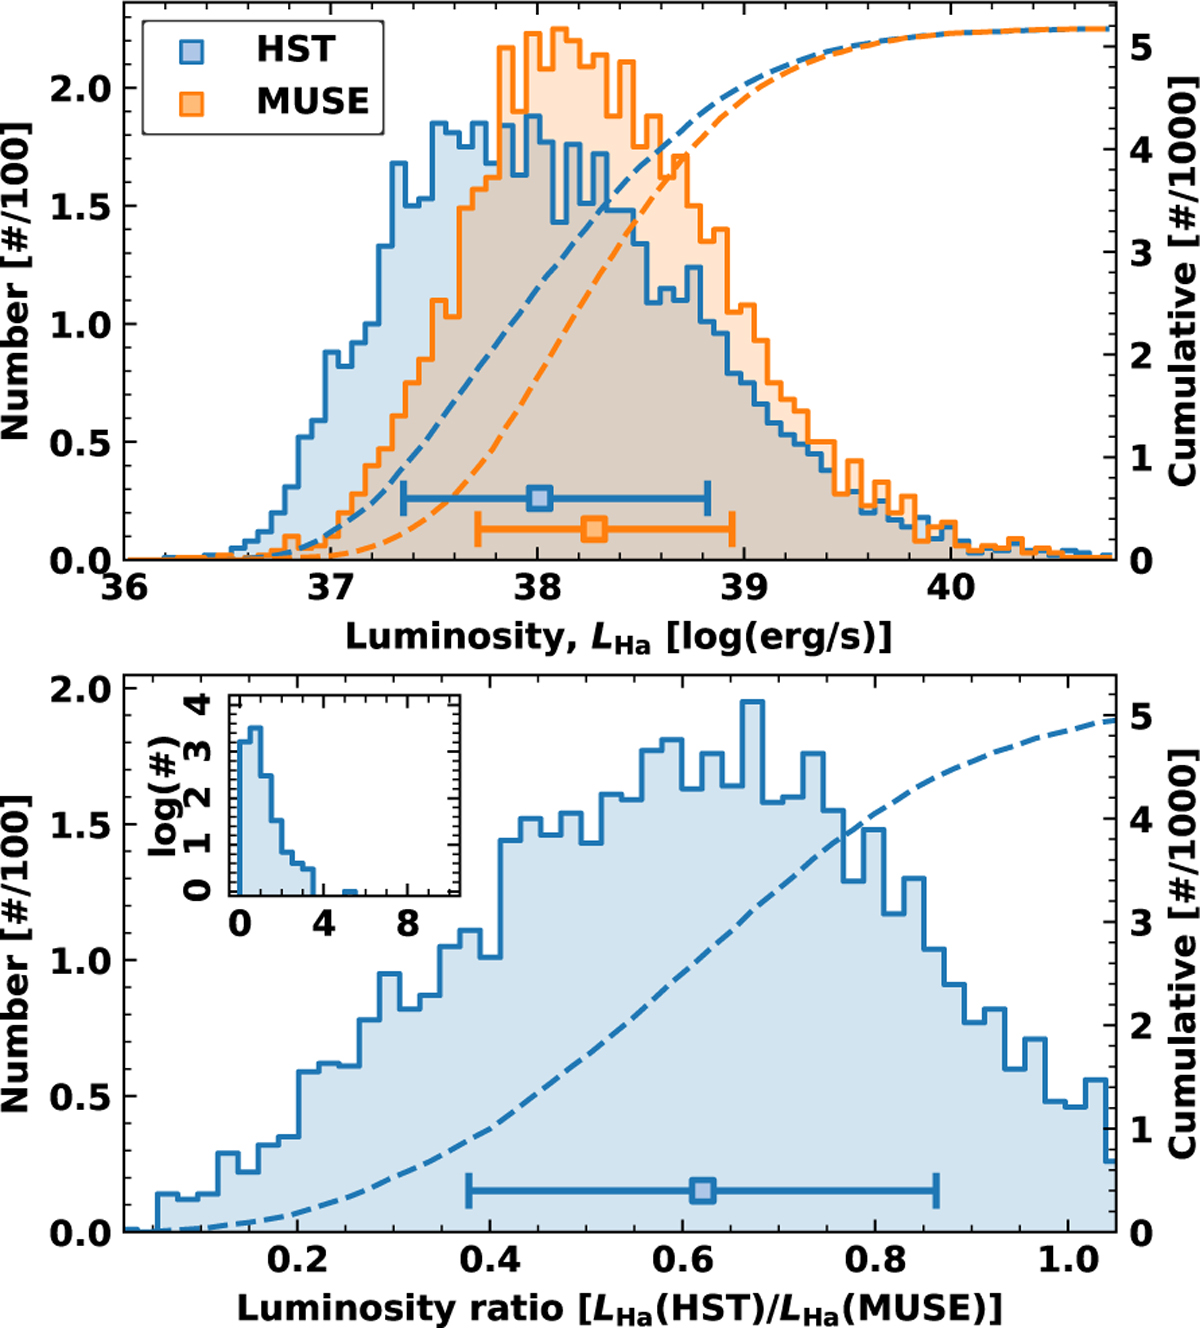
Distribution of source luminosities for all regions in the Nebula Catalogues. In blue and orange we show the distribution for sources identified in both the HST and MUSE observations. Note that we only show the MUSE sample that was also identified by HST (i.e. not the full sample identified by Groves et al. 2023). The inset axis shows a larger range in luminosity ratios, and is shown in a log distribution for clarity. In contrast to Fig. 4, this shows that despite the regions being much smaller in the HST observations, they still typically retain a significant fraction of the flux.
Current usage metrics show cumulative count of Article Views (full-text article views including HTML views, PDF and ePub downloads, according to the available data) and Abstracts Views on Vision4Press platform.
Data correspond to usage on the plateform after 2015. The current usage metrics is available 48-96 hours after online publication and is updated daily on week days.
Initial download of the metrics may take a while.